Link para o artigo original : https://www.acadian-asset.com/investment-insights/equities/polarizing-views-chinas-impact-on-em-investing#
Polarizing Views: China’s Impact On EM Investing
December 2021
China’s rise has led many asset owners to reevaluate their EM allocation approaches. Applying a systematic lens to analyze salient questions raised, we conclude that:
Key Takeaways
- Because EM benchmarks are active constructs, amalgamating judgment calls and interests, investors should start from the presumption that their particular objectives and geopolitical views will call for a material benchmark-relative overweight or underweight to China.
- In response to the increased integration of emerging and developed markets, active allocations should emphasize: 1) in China, the onshore market relative to offshore, and 2) in EM ex-China, expansive investment universes and locally-oriented market segments.
- In composing active EM allocations, investors who have the requisite flexibility should pool the opportunity set across China and EM ex-China. Doing so, however, calls for a scalable and sophisticated investment process.
Investment posture with respect to China has become a divisive topic. Investors at one pole have championed a historic opportunity stemming from the country’s rapid economic ascendance and enormous yet still developing financial markets (Figure 1). At the other pole, an increasingly vocal chorus has challenged the durability of China’s growth, its commitment to market-based economics and property rights, and its track records on human rights and the environment. No matter where an asset owner stands between these poles, questions of how much and how best to allocate to China—and the rest of EM—should be of first order importance to stewards of institutional assets.
Indeed, in response to the growth of China’s share of the index, many asset owners and consultants have questioned whether they should continue to allocate to EM based on benchmark definitions and weights or split out China from the rest of EM. Asset owners who already have China-focused strategies are considering the merits of EM ex-China allocations to complete their portfolios. Investors looking to modulate their exposure to China have expressed uncertainty over how best to do so and, in particular, whether and how to access the onshore market (i.e., A-Shares listed in Shanghai and Shenzhen). Unfortunately, these questions often receive neither as complete nor as careful analysis as they warrant, owing to the temperature of the political conversation around China, perceived opacity of China’s markets, and the peculiarities of entrenched EM benchmarks.
Figure 1: China’s Weight in the MSCI Emerging Markets Index
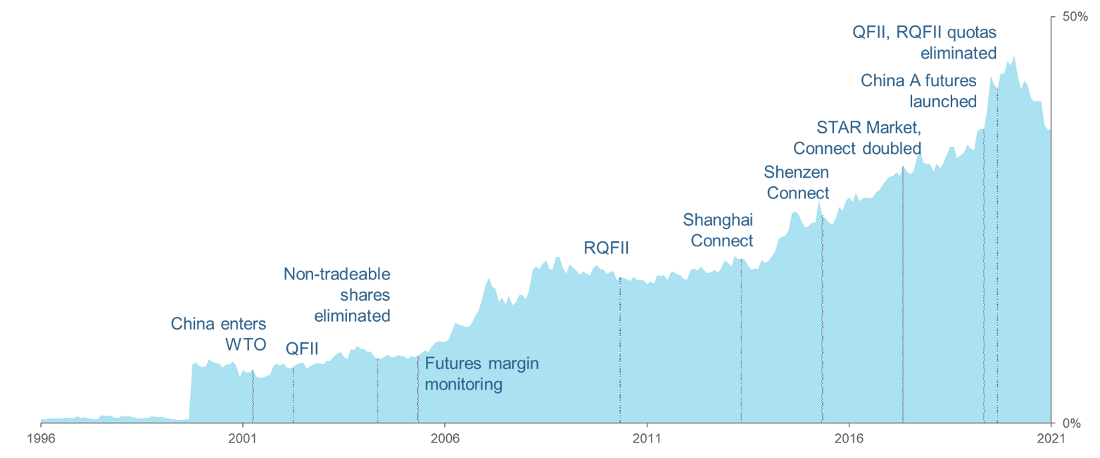
Sources: Acadian Asset Management LLC, MSCI. MSCI data copyright MSCI 2021. All Rights Reserved. Unpublished. PROPRIETARY TO MSCI. For illustrative purposes only. It is not possible to invest directly in an index. Past results are not indicative of future results.
The purpose of this note, therefore, is to analyze the implications of China’s rise for EM allocators through the lens of a systematic active investor. First, we appraise the extent of the country’s impact on the EM landscape and its relationship with global systemic risk. Next, we highlight two challenges facing EM investors that should influence their allocation approaches: 1) the active and peculiar nature of EM benchmarks and 2) the increased integration of emerging and developed markets. We then discuss the actionable implications of these themes with respect to China and EM ex-China investments, individually, and for broader EM portfolio construction.
China’s Impact on EM
Based purely on corporate fundamentals and economics, it would be difficult to escape the conclusion that China warrants an allocation in excess of its weight in the most prominent EM benchmark, the MSCI Emerging Markets Index. We estimate that the total capitalization of Chinese stocks accessible to foreign investors represents roughly 53% of emerging and 8% of global markets, respectively.1 Those market-cap shares are consistent with the companies’ contributions to aggregate corporate revenues, which we estimate at roughly 48% for emerging and 14% for global universes, respectively. They are also reasonably consistent with China’s economic footprint. China accounts for more than half of EM’s GDP and nearly a quarter of the world’s, almost on par with the U.S.2 (Figure 2).
Figure 2: China’s GDP Share
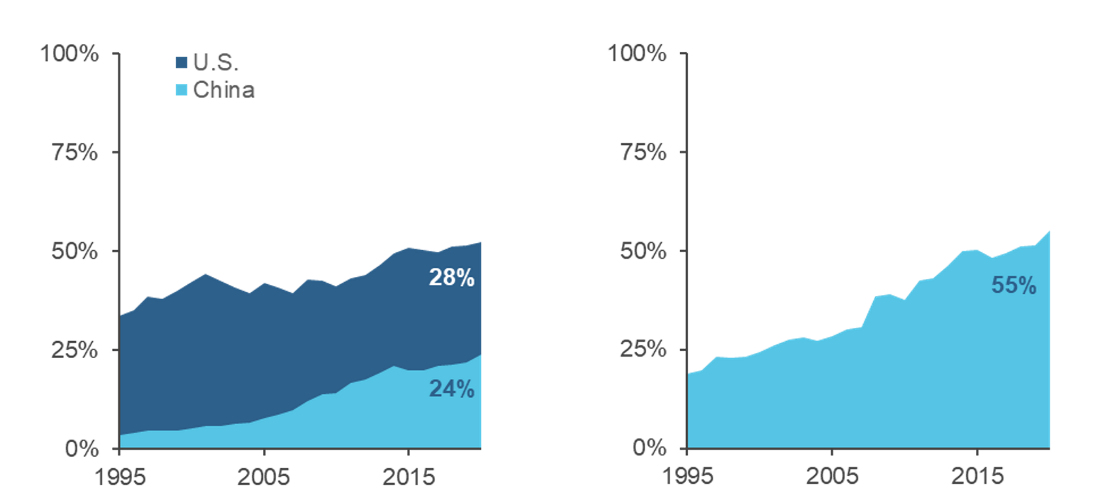
Left panel shows U.S. and China shares of global GDP. Right panel shows China share of EM GDP. All GDP shares based on nominal GDP in USD aggregated across global universe computed annually. Sources: Acadian, Datastream (Thomson Reuters), MSCI Copyright MSCI 2021, All Rights Reserved. Unpublished. PROPRIETARY TO MSCI. For illustrative purposes only.
In contrast, China’s shares of MSCI’s EM IMI and ACWI IMI indexes are only roughly 31% and 4%, respectively.3 Those weights reflect an 80% haircut applied to Chinese stocks listed onshore as well as other inclusion restrictions. The haircut represents an active call with respect to accessibility on the part of the index provider, reflective of its judgments about foreign ownership limits and institutional stability as well as the interests of its diverse subscriber base. That decision, while well-researched and thoughtful, is unlikely to map to the views and needs of any particular asset owner. For example, even a “passive” market-cap allocation would represent a sizeable benchmark overweight. Yet for asset owners with geopolitical or ESG-related concerns about China, the haircut might not do enough to curb the already substantial benchmark exposure. In other words, most allocators should be prepared to depart from EM benchmark weights.
The relevance of China’s economic rise and financial development to allocators extends beyond China’s raw weight in the EM benchmark: China has become intertwined with global systemic risk. One way to view this is through the lens of trade, with the U.S. serving as a useful foil. By some measures, China is now the world’s largest trading nation. It is involved in roughly a quarter of aggregate global activity, and it is a larger trade partner than the U.S. for 152 of 207 countries.4 Moreover, China is the source of approximately 7% of developed market corporate revenues, larger than any single DM country other than the U.S. Similarly, China also accounts for nearly 9% of corporate revenue in other emerging markets, not far from the U.S. at 13% (Figure 3).
Figure 3: China’s Contribution to Global Corporate Revenues by Region
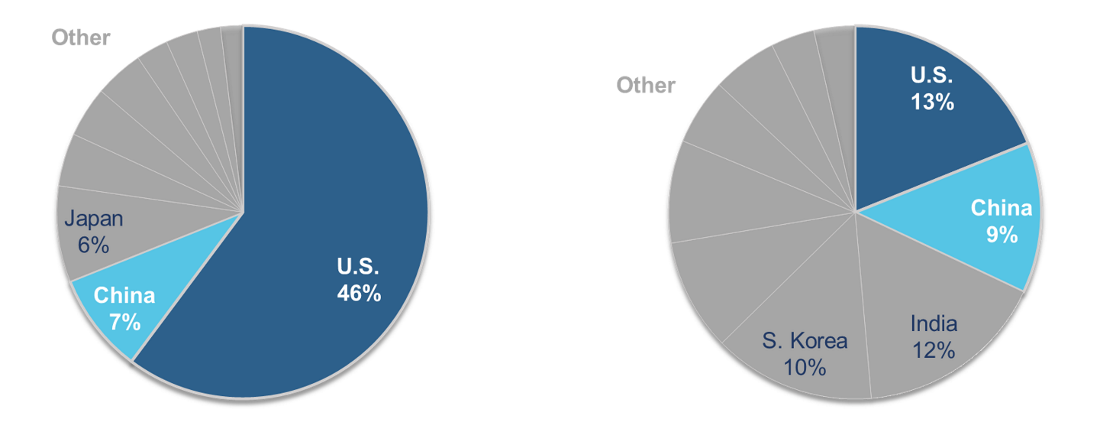
Charts show top 10 corporate revenue contributions aggregated by country within each region. DM corresponds to MSCI World while EM ex-China corresponds to the EM universe from which both China offshore and China onshore have been excluded. Sources: Acadian, FactSet Revere Revenue Contribution dataset (GeoRev) for stock-level revenue proportions, MSCI. MSCI data Copyright MSCI 2021, All Rights Reserved. Unpublished. PROPRIETARY TO MSCI. For illustrative purposes only.
Despite geopolitical countercurrents to globalization, we find it difficult to envision a quick reversal of China’s systemic importance. Even the U.S. has deep interests in preserving China’s role in global trade. China has become a top-three export destination for 32 of 50 U.S. states and the largest import source for 41.5 A 2019 study of the China-U.S. trade war provided evidence for the intuitive explanation—China’s relative competitiveness. It found evidence that tariffs on Chinese firms translated into increased exports for other non-U.S. companies, suggesting that Chinese goods and services indeed had been more competitive to begin with. Moreover, China’s share of U.S. imports quickly recovered from the trade war in the wake of COVID, highlighting the sustained policy commitment that likely would be required to push back on China’s trade share.
Two Challenges Facing EM Allocators
In addition to considerations related to sizing, asset owners should be mindful of two issues relevant to how they allocate to both China and the rest of EM: 1) peculiarities of relevant benchmarks, which reduce their appeal as the basis for either China and/or ex-China allocations, and 2) the integration of global financial markets, which has eroded aspects of EM’s distinctiveness relative to DM.
With regard to benchmarks, one concern is that EM indexes became highly concentrated in recent years. The phenomenon was driven by the strong performance of globally prominent growth-oriented EM mega-cap stocks, which included Chinese companies listed offshore (i.e., in Hong Kong or via ADRs), such as Alibaba and Tencent, as well as Taiwan Semiconductor and Samsung.6 In fact, at their peak, the top-five constituents of MSCI EM accounted for roughly 27% of the index7 (Figure 4). Risk associated with such firm-level concentration flared up during 2021, when Chinese regulators cracked down on major platform companies listed offshore, leading to 30-50% declines in these stocks and causing China’s offshore market to sharply underperform onshore and the rest of EM.
Figure 4: Benchmark Concentration — Index Weight in Top-Five Stocks
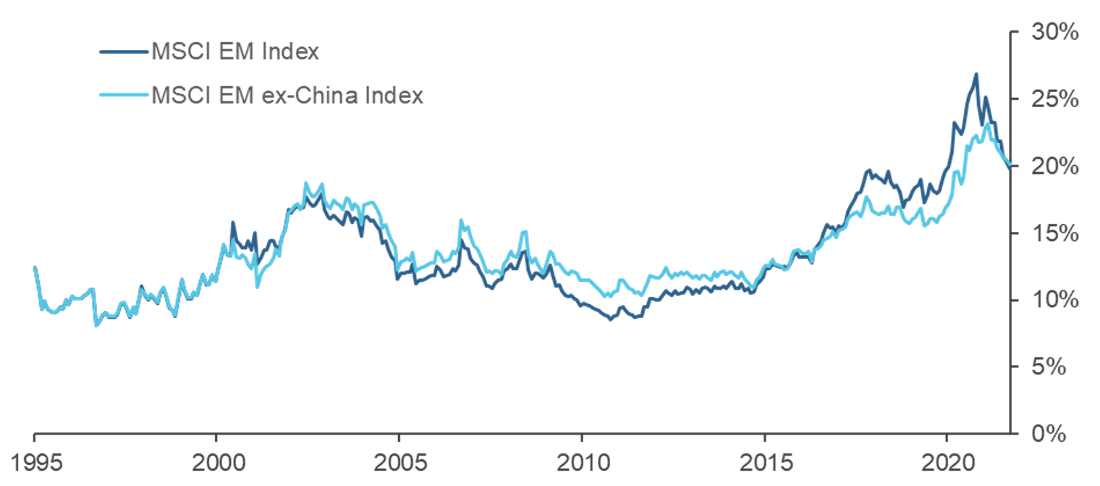
Chart shows the sum of the top-five index weights in the MSCI EM and MSCI EM ex-China Index. Sources: Acadian, MSCI Copyright MSCI 2021, All Rights Reserved. Unpublished. PROPRIETARY TO MSCI. For illustrative purposes only.
With respect to the EM ex-China benchmark, not only is it plagued by concentration in several respects, but it is also of questionable emerging character. While MSCI’s EM ex-China Index is comprised of almost 700 stocks, it has been behaving like it contains only about 60. Just two DM-oriented technology firms—Samsung and Taiwan Semiconductor—account for a 15% share. The index has fully half its weight in IT and financials. In addition, while MSCI’s EM ex-China universe includes 26 countries, South Korea and Taiwan have a combined weight exceeding 40%. It is not clear that South Korea, at least, is still emerging: in 2021, it became the first country that UNCTAD (UN Conference on Trade and Development) ever promoted to developed status.8
Finally, a separate concern with respect to MSCI’s mid/ large-cap EM benchmark is that it provides distorted exposure to China’s overall equity market. The bias stems from both differences in the characteristics of stocks listed onshore versus offshore and the index’s inclusion restrictions. Companies listed onshore skew decidedly towards the smaller end of the capitalization spectrum. In fact, small-caps comprise roughly 40% of the investable A-Share universe, by weight, as compared to about 10% for stocks listed offshore. The combination of the onshore market’s small-cap orientation, the 80% capitalization haircut applied to A-Shares that are included in the benchmark, and the exclusion of A-Shares that cannot be accessed via HK StockConnect, implies that only about 10% of the capitalization of the onshore investable universe is represented in the MSCI mid/large-cap EM index. That amounts to a major coverage gap, because China’s onshore investable universe is larger than that available offshore in terms of both cap ($4.5T versus $3.1T) and issues (4,280 versus 739).9 Moreover, not only is the resulting overall China exposure biased in terms of firm size, but it is also distorted in terms of sectoral composition. The offshore market is dominated by consumer discretionary and communications stocks, with 33% and 18% shares, respectively, while the onshore market is considerably better balanced.10
In addition to peculiar benchmarks, EM investors face a challenge from the increasing integration of global markets. Part of EM investing’s appeal has long been rooted in a sense that emerging markets are distinct. In some respects, that distinctiveness has eroded over time, however. Figure 5 provides evidence. The left panel shows that the fraction of EM index returns explainable by global systemic factors, as mediated through developed market indexes, has risen materially over the past twenty years.11 In other words, EM stocks have lost some of their “local” flavor. The right panel shows that the trend is part of a broader phenomenon affecting developed markets, as well. In addition, we find that the loss of EM distinctiveness is not driven by a few globally prominent large-cap stocks. Smaller-cap EM quintile portfolios have grown materially better integrated with global markets, significantly closing the gap with the larger caps. While alpha generation opportunities in EM remain robust, the global economic integration that has been a boon to asset prices over the past thirty years has likely diminished at least some of the distinctiveness – and attendant diversification benefit – that EM has historically afforded.
Figure 5: Global Market Integration and the Erosion of EM’s Distinctiveness
Fraction of Returns Explained by DM Indexes
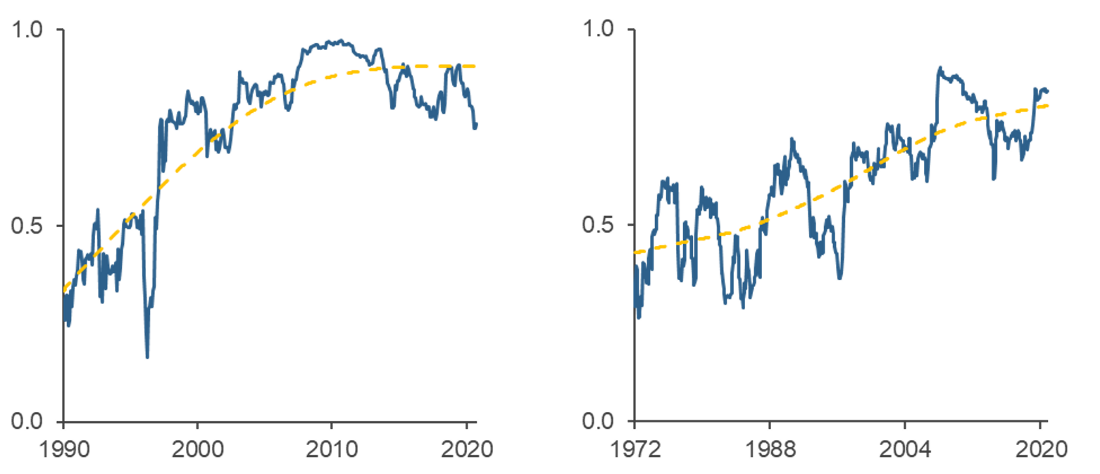
Left chart shows the rolling 36-month fit (adjusted R-Squared) of MSCI EM Index returns explained by 15 major DM equity indexes. The dotted lines represent application of a Hodrick-Prescott filter to the raw data. Right chart shows the average R-Squared from regressions of returns of each of the 15 DM indexes, individually, regressed on the other 14. Sources: Acadian, MSCI Copyright MSCI 2021, All Rights Reserved. Unpublished. PROPRIETARY TO MSCI. For illustrative purposes only.
Implications for Allocators
The themes discussed in the prior sections have far-reaching implications for EM investors from across the spectrum with respect to objectives for their EM allocations and views about China. We first highlight salient considerations with respect to allocating to China and EM ex-China, individually, and then we consider EM portfolio construction, i.e., putting the pieces together.
CHINA
For investors seeking active returns from EM, their investments in China should include a material onshore component owing to the additivity of that market segment. This inference is not a pitch for investing in China. It is as relevant to those looking to limit their China exposure as to those looking to embrace it, because the observation informs how to deallocate, from the offshore market first
We can frame the argument for China A exposure as an antidote to EM’s eroding distinctiveness. The left panel of Figure 6 compares the degree of global market integration across selected segments of EM using a metric similar to that from Figure 5.12 The chart suggests that returns of EM as a whole, EM ex-China, China’s offshore market, and South Korea to a great degree can be explained by select global risk factors, i.e., these segments reflect a high degree of integration. But that is not the case for China’s onshore market. It looks distinct, with systemic global drivers explaining only 41% of its aggregate returns variation. By this measure, China A-shares have unusual local character, similar to what we see in Frontier.13
Figure 6: Global Market Integration and the Information Environment
Cross-sectional Comparisons
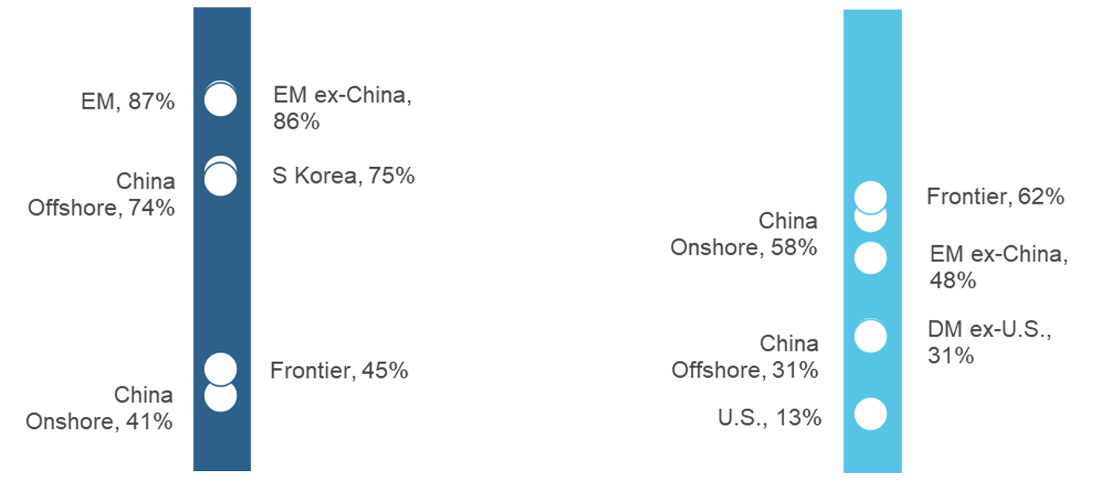
Left chart shows adjusted R-squared from 36-month regression of major market returns on market-based and industry risk factor returns using a commercially available risk model. Right chart shows analyst coverage based on IBES estimates for stocks over $100M USD in market capitalization using Acadian universe of securities across major regions. 36-month regression as of Aug 21 and analyst coverage as of Dec 20. Sources: Acadian, MSCI Copyright MSCI 2021, All Rights Reserved. Unpublished. PROPRIETARY TO MSCI. For illustrative purposes only.
Several factors contribute to A-Shares’ distinctiveness. First, the marginal onshore investor differs from that in other global markets. While retail investors account for only 20% of activity in the U.S., in China’s onshore market they generate 80% of volume and own approximately 58% of tradable shares.14 Institutional investing is comparatively immature; the Chinese mutual fund industry is only roughly twenty years old, flows are mercurial, and the companies state owned through complex governance structures. Equity ownership by foreign investors remains limited, amounting to less than 5% of capitalization.15 Second, the firms listed in the onshore market are more locally oriented than in China’s offshore market. As noted above, onshore companies skew smaller-cap and have greater weight in sectors that academic literature has identified as having more locally oriented characteristics, including consumer staples and healthcare.16 Finally, as summarized in Figure 6, the information environment for China A-Shares is, in some ways, less well-developed than for other global stocks. For example, nearly 60% of A-Share companies have no analyst following by a traditional measure, as compared to only 31% of Chinese stocks listed offshore. In this respect, too, A-Shares bear resemblance to Frontier.
What makes the onshore market so important for allocators, though, is its size and tradability. While China A resembles Frontier in terms of distinctiveness and aspects of the information environment, its $4.5T market cap is roughly 30 times larger than Frontier. Moreover, the market is liquid, especially in small caps. Figure 7 shows, for example, that A-Share turnover exceeds even that of U.S. stocks among small caps (less than $5 billion), which typically translates into lower execution costs (e.g., tighter spreads and lower estimated VWAP costs for comparable controlled size).
Figure 7: The Liquidity of Onshore Chinese Equities
China A Dollar Turnover as percent of U.S.
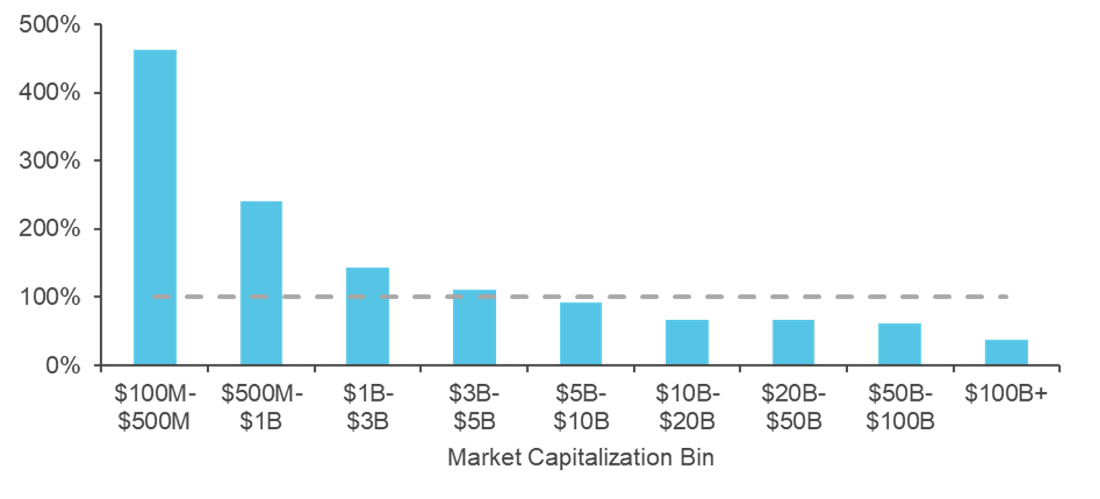
Chart shows the China A time series median ADV by cap bucket as a percent of the same measure for the U.S. In both markets, the time series median is calculated between Jan 2017-Oct 2021 weekly on cross-sectional median ADV for stocks over $100M USD in capitalization and over $125K ADV. Sources: ITG, Acadian, MSCI Copyright MSCI 2021, All Rights Reserved. Unpublished. PROPRIETARY TO MSCI. For illustrative purposes only.
But the distinctive nature of China’s onshore market calls for a variety of adaptations, and allocators should seek managers with the requisite flexibility and sophistication in their investment processes. China A requires different data sources and, for text processing, a different language. In forecasting, it requires specialized signal selection, constructions, and weightings. As a broad example motivating the need for adaptation, generic momentum signals historically have not been effective in China A. As a more nuanced example, we find that the active retail participation changes the relationship between volume and future returns as compared to other markets. Moreover, the ongoing evolution of the onshore market, shaped by the Chinese government, will change the opportunity set. We expect that the onshore market will become better integrated with global markets as the information environment improves, foreign ownership grows, and the marginal investor changes in character. That implies a need for ongoing adaptability and increasing sophistication to tap the active opportunity set.
In addition to active returns generation potential, practitioner literature promoting China A often touts diversification benefits from such allocations based on the low historical correlation between A-Shares and DM benchmarks. But investors should not take risk reduction for granted. First, China A-Shares have been materially more volatile than both other EM stocks and DM equities. Ten-year trailing volatility of MSCI’s China A index has been 23.8% versus 17.7% and 13.4% for its EM and DM indexes, respectively. Moreover, the onshore market’s low correlation with DM partly reflects circumstances that posed significant risk to global investors. Figure 8, for example, shows that while rolling China A-DM index correlation fell to 0 in the mid-teens, that dip occurred amid a speculative bubble in the onshore market, after which A-shares fell nearly 50%. In addition, the high degree of interdependence between the global economy and China suggests that A-shares, despite their local character, should not be relied upon as a safe haven with respect to global economic shocks.
While the empirics of China A’s risk reduction impact on a broader EM portfolio are complex, the onshore market’s composition highlights advantages of a diversified investing approach in China. As discussed previously, the offshore market is, by comparison, both top-heavy and sectorally-narrow. The recent regulatory crackdowns by the Chinese government, which targeted specific sectors, highlighted the vulnerabilities of such concentration. In addition, the crackdowns suggest a subtle benefit to a value orientation in China: it may be prudent to lean away from stocks “priced to perfection” and high-flyers that might make good targets for regulators eager to set examples.
Figure 8: Onshore China-DM Correlation — A Closer Look
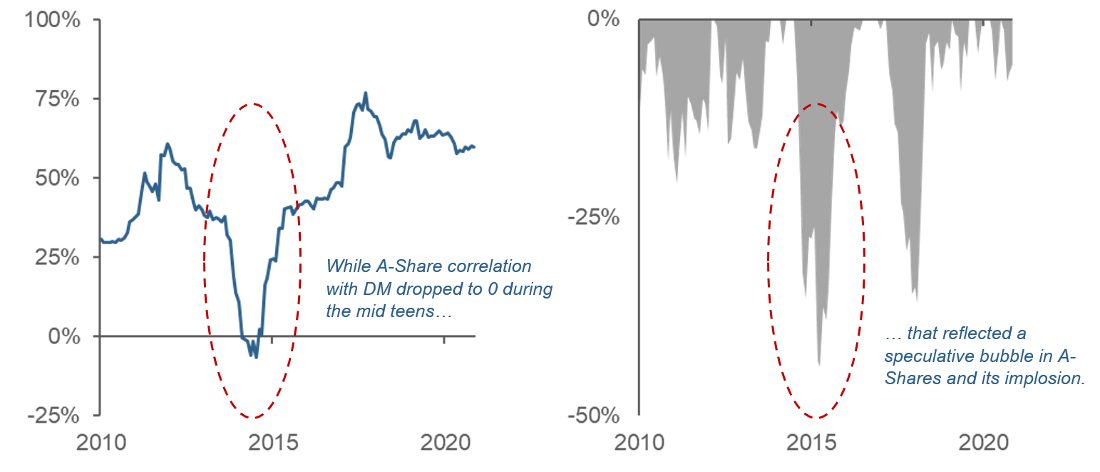
Left chart shows rolling 36-month return correlation of China A vs DM (MSCI World) USD returns. Right chart shows rolling 24-month max drawdown of China A USD total return index. Sources: Acadian, MSCI Copyright MSCI 2021, All Rights Reserved. Unpublished. PROPRIETARY TO MSCI. For illustrative purposes only.
EM EX-CHINA
Investors seeking active returns or diversification from EM ex-China allocations should employ expansive investment universes, extending beyond the benchmark and even, perhaps, traditional EM contours. We can frame the motivation in terms of integration and concentration. In the second section of this note, we highlighted that the EM ex-China benchmark has substantial weights in South Korea and Taiwan as well as Samsung and Taiwan Semiconductor, in particular. It should be no surprise, therefore, that nearly 90% of the index’s returns are explainable by global factors, as shown in the left panel of Figure 6. These observations suggest that when allocating to EM ex-China, active investors should seek strategies oriented towards local stocks rather than strategies that focus on well-integrated market segments, which may largely echo DM characteristics. They also suggest pushing into Frontier or less well-integrated slices of DM.
Exploiting the more distinctive portions of the EM ex China universe still requires attentive diversification. The reason being that aspects of concentration remain even outside of the conventional, but restrictive, universe of large/mid-cap benchmark holdings. Figure 9 shows that India, South Korea, and Taiwan comprise over 50% of investable off-benchmark-stocks (dark blue bars), similar to these countries’ aggregate weight in the MSCI EM ex-China Index. Moreover, prior to the November 2021 rebalance, the next three countries by cap were Russia, Brazil, and Argentina (light blue bars). All of those countries are associated with material geopolitical or headline risk (which, more or less, led to Argentina being pulled from the MSCI EM Index and moved to standalone, having just been inserted in 2019). Such qualities are part and parcel of EM investing and reinforce the case for diversification in ex-China allocations. That, in turn, requires sophisticated implementation to manage position sizing and transaction costs.
Figure 9: EM ex-China — Off-Benchmark Weight by Country
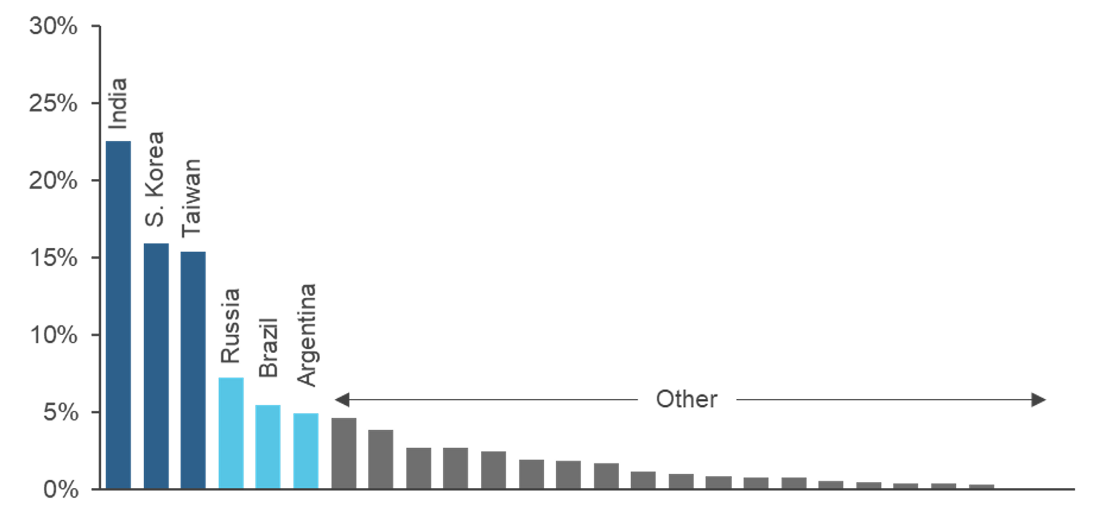
Chart shows the total cap by country of stocks over $125K in 1-month ADV, over $50M in float-adjusted capitalization and available to global investors but excluded from the MSCI EM ex-China Index. Sources: Acadian, MSCI Copyright MSCI 2021, All Rights Reserved. Unpublished. PROPRIETARY TO MSCI. For illustrative purposes only.
For many asset owners, an additional risk-related consideration in EM ex-China allocations will be (or perhaps should be) the degree of residual China exposure that remains. As highlighted in the first section of this note, China’s deep integration with the global economy implies that ex-China portfolios will retain material China exposure through the global market factor. But the extent and diversity of China’s economic relationships also suggests that the degree and nature of China exposure may depend on the specific composition of those portfolios. That observation has constructive implications. On the one hand, it may be possible to reduce portfolio economic exposure to China by analyzing company fundamentals and relationships, analogous to engineering an ESG tilt. On the other hand, for investors worried about headline and governance risk associated with China allocations, it may be possible to maximize exposure to the country without directly owning Chinese assets.
CONSTRUCTION
In crafting an EM allocation, key decisions will likely hinge as much on governance as investment considerations. Viewing governance as a spectrum, towards the permissive end, we envision investment staff who have considerable discretion around loose allocation targets and a significant active risk budget. Towards the restrictive end, we envision investment staff who are handed precise policy weights and less room to maneuver.
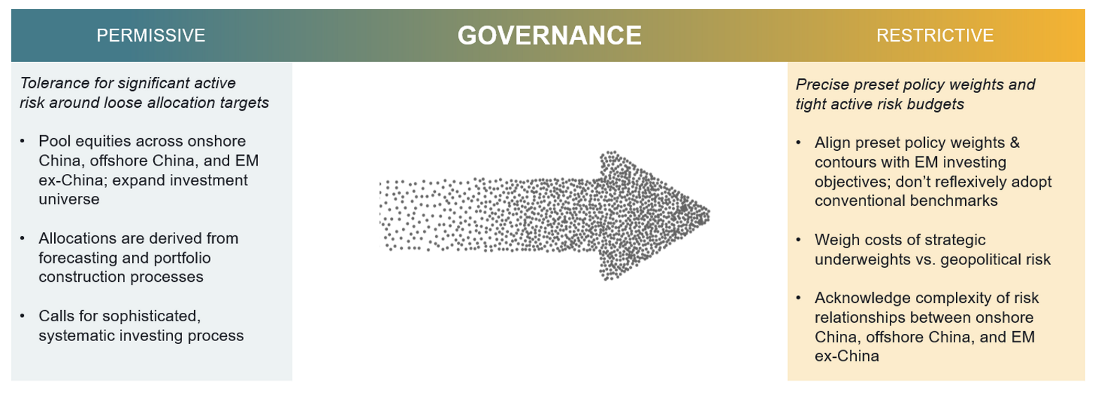
For asset owners that find themselves on the permissive end of the spectrum, the theory of active management advises pooling the investment universe across onshore China, offshore China, and EM ex-China to form a single active portfolio rather than creating separate allocations. Pooling affords the greatest flexibility to trade off expected return against risk and costs. Ex-ante partitions inhibit that flexibility, and we would expect such constraints to undermine performance. The foregoing discussion would also recommend expanding the investment universe beyond benchmark constituents and, possibly, outside of conventional EM contours. Permissive governance is a prerequisite for pooled and expansive approaches, because they involve managing to a custom benchmark or taking substantial active risk around a conventional one.
Expressed in pragmatic terms, the advantage of pooling is that it allows the investment process to determine the allocations to onshore China, offshore China, and ex-China. Ideally, positioning would be informed by expansive information sets and continuously refreshed forecasts of stock returns, risks, and trading costs. It would be governed by sophisticated portfolio construction machinery that layers in a variety of prudent risk controls. These attributes imply a sophisticated systematic investing process— systematic because an expansive investment universe requires scalability and sophistication in order to generate comparable stock returns forecasts and manage risk across diverse market segments, such as China A and Latin America.
For asset owners at the restrictive end of the governance spectrum, the first goal should be to align ex-ante policy weights and portfolio contours with EM investing objectives, whether they be accessing economies with particular development profiles, active returns generation, portfolio diversification, or ESG considerations. Investors should not reflexively adopt EM benchmark definitions and weights. As discussed in the first two sections of this note, EM benchmarks are active constructs, so investors should not expect that they will map naturally to their needs and views.
Second, in setting exposure to China, allocators should carefully weigh the tradeoff between any geopolitical concerns and potential costs of strategic underweights. Finance theory and empirics suggest that keeping many lines in the water, i.e., owning a well-diversified portfolio, is key to long-term success in equity investing. Over long horizons, cap-weighted returns tend to be driven by substantial appreciation of a relatively small number of stocks.17 Unless investors can foresee which stocks those will be in advance, material long-term exclusions or underweights risk substantial opportunity cost.
Finally, investors subject to restrictive governance should not underestimate the challenge of factoring the time varying risk relationships between onshore, offshore, and ex-China markets into their ex-ante positioning. China’s recent regulatory crackdowns highlight the need for nuanced analysis. While in that episode the offshore market was hit hard by targeted policy actions, the onshore market was affected to a much lesser degree, and there was little perceptible impact on the rest of EM. In contrast, in the early stages of COVID, which were accompanied by an oil price war, the nature and sequencing of events generated materially greater volatility in EM ex-China than either onshore China or offshore China (Figure 10). Not only are the risk relationships between these three segments context dependent, they also are constantly evolving as the underlying markets develop. Analyses in practitioner literature are often too narrow or overextrapolate historical patterns. They fail to replicate the richness of sophisticated portfolio construction machinery embedded in systematic approaches.
Figure 10: Risk Dynamics — Offshore China, Onshore China, and EM ex-China
Rolling 3-Month Volatilities
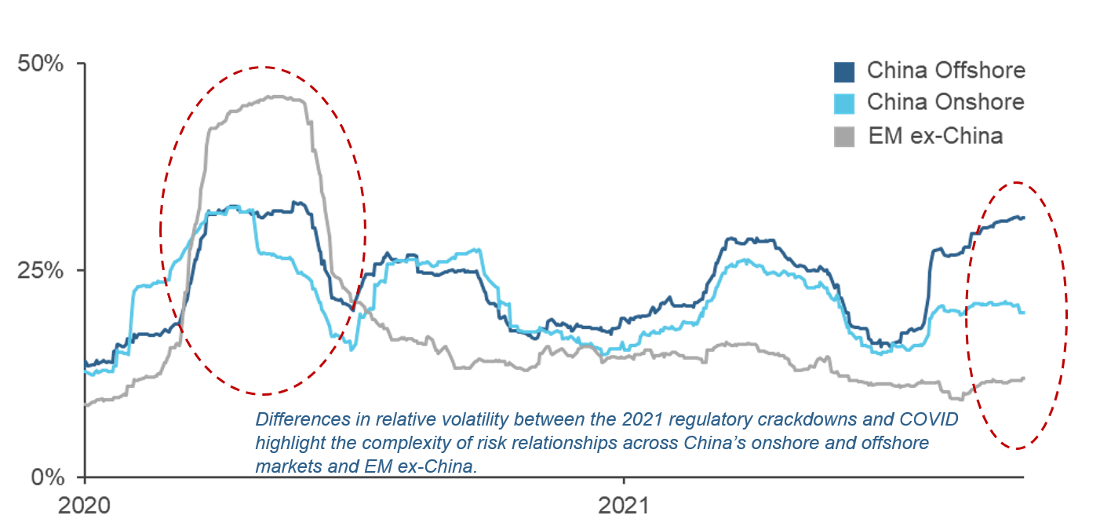
Chart shows rolling 60-day volatility of USD total gross returns to the MSCI China Index, MSCI China A Index and the MSCI Emerging ex China Index. Sources: Acadian, MSCI Copyright MSCI 2021, All Rights Reserved. Unpublished. PROPRIETARY TO MSCI. For illustrative purposes only.
EM Investing: Time for a Reset?
Naturally, many investors approach EM allocation decisions from the starting point of established benchmarks. As we have highlighted in this note, however, EM benchmarks are highly active constructs, representing an amalgamation of judgment calls and interests. In reassessing EM allocations in view of China’s rise, therefore, asset owners should start from the presumption that their particular EM objectives and geopolitical views will call for a material benchmark-relative overweight or underweight to China, as a whole.
Moreover, investors should expect their objectives to call for material divergence from the benchmark in terms of how and where they allocate within China and EM ex-China, individually. To counter the influence of global market integration, active investors should, in China, emphasize the onshore market relative to offshore. In the rest of EM, they should pursue expansive opportunity sets and deliberately emphasize market segments with local flavor, pushing beyond benchmarks and, perhaps, conventional EM contours. Throughout their EM portfolios, investors should be wary of the many forms of concentration found in conventional benchmarks—stock-, country-, and sector-wise—and recommit to diversification.
In composing active EM allocations, we advocate pooling the investment universe across China and EM ex-China. Doing so requires permissive governance, however, and also calls for an investment process that is both scalable and sophisticated enough to generate comparable return forecasts and manage risks across highly variegated markets. Investment staff operating under more restrictive governance should seek careful alignment of preset policy portfolio scope and weights with their organization’s EM objectives and views while also applying expansive investment universes and sophisticated approaches to best exploit the active opportunities that they are afforded.
Taking a step back, questions that allocators have raised in relation to China’s rise call attention to broader issues in EM investing. We view the resulting discussion as an opportunity for asset owners to reexamine their EM allocation approaches and strategies, more broadly.
FOOTNOTES
- In the context of this note, investability reflects stocks with float adjusted cap over $50M, average daily dollar volume over $125K and other criteria
based on data availability, liquidity. It does not include limits on total foreign ownership, which China caps at 30% for A-Share listed companies. - Source:World Bank China Country Overview, updated Oct 12, 2021. Although China’s growth is slowing, it has averaged nearly 10% since reforms began
in the 1970s, accelerating in the mid-2000s after China joined the WTO amid robust global expansion. While the U.S. Federal Reserve believes that
China smooths out the cyclicality of its official GDP data, it finds evidence consistent with the broader trend, based on satellite and other alternative data. See Hunter Clark, Jeff Dawson, and Maxim Pinkovskiy,How Stable is China’s Growth?Shedding Light on Sparse Data, Federal Reserve Bank of New
York, Economic Policy Review, 26, No. 4, October 2020. - We base the point of comparison on IMI versions of the benchmarks, because they, by definition, capture a broader representation of the economy than the mid/large-cap indexes.
- Based on IMF Direction of Trade Statistics (DOTS).
- Source: United States Census Bureau data for 2020. Seehttps://www.census.gov/foreign-trade/statistics/state/data/index.html.
- Companies referenced here and throughout this document are mentioned for illustrative purposes only and should not be considered as recommendation to buy or sell any specific securities.
- See Quick Take: A Historic Year for Emerging Markets Mega Caps, Acadian, January 2021.
- South Korea is also treated as a developed country in other index families, such as FTSE.
- As of June 30, 2021. As a point of comparison, in most world markets only about 15-20% of the investable universe lies outside of the mid/large-cap index.
- See Accessing China: Offshore vs. Onshore/A, Acadian, August 2021.
- The methodology is based on that developed in Kuntara Pukchuanthong and Richard Roll, Global Market Integration: An Alternative Measure and Its
Application, Working Paper, January 10, 2009 and applied in Cheol Eun, Soohun Kim, Fengrong Wei, and Teng Zhang, Global Diversification with Local
Stocks: A Road Less Traveled, Working Paper, July 8, 2017. These authors use principal component analysis (PCA) applied to various groups of indexes to impute global factors. - Specifically, this chart shows R-squared from 36-month regression of major market returns on market-based and industry risk factor returns using a commercially available risk model.
- Recognizing that the onshore market’s behavior is not well-captured by either global factors or China’s offshore market, Axioma, a producer of
sophisticated risk models, introduced a domestic factor for China, the only one of its kind. - 14 See: Who Counts as a Retail Investor?, Nasdaq, December 2020; Jia Li, Yun Chen, Yan Shen, Jingyi Wang, Zhuo Huang, Measuring China’s Stock Market Sentiment, Economic Research Initiatives at Duke, Working Paper Number 285, April 2019; Chunxin Jia, Yaping Wang, and Wei Xiong, Social Trust and Differential Reactions of Local and Foreign Investors to Public News, NBER Working Paper 21075, April 2015.
- Institute of International Finance, April 2021.
- See Cheol Eun, Soohun Kim, Fengrong Wei, and Teng Zhang, Global Diversification with Local Stocks: A Road Less Traveled, Working Paper, July 8, 2017.
The value of investments may fall as well as rise and you may not get back your original investment. Past performance is not necessarily a guide to future performance or returns. Acadian has taken all reasonable care to ensure that the information contained in this material is accurate at the time of its distribution, no representation or warranty, express or implied, is made as to the accuracy, reliability or completeness of such information.
This material contains privileged and confidential information and is intended only for the recipient/s. Any distribution, reproduction or other use of this presentation by recipients is strictly prohibited. If you are not the intended recipient and this presentation has been sent or passed on to you in error, please contact us immediately. Confidentiality and privilege are not lost by this presentation having been sent or passed on to you in error.
Acadian’s quantitative investment process is supported by extensive proprietary computer code. Acadian’s researchers, software developers, and IT teams follow a structured design, development, testing, change control, and review processes during the development of its systems and the implementation within our investment process. These controls and their effectiveness are subject to regular internal reviews, at least annual independent review by our SOC1 auditor. However, despite these extensive controls it is possible that errors may occur in coding and within the investment process, as is the case with any complex software or data-driven model, and no guarantee or warranty can be provided that any quantitative investment model is completely free of errors. Any such errors could have a negative impact on investment results. We have in place control systems and processes which are intended to identify in a timely manner any such errors which would have a material impact on the investment process.
Acadian Asset Management LLC has wholly owned affiliates located in London, Singapore, and Sydney. Pursuant to the terms of service level agreements with each affiliate, employees of Acadian Asset Management LLC may provide certain services on behalf of each affiliate and employees of each affiliate may provide certain administrative services, including marketing and client service, on behalf of Acadian Asset Management LLC.
Acadian Asset Management LLC is registered as an investment adviser with the U.S. Securities and Exchange Commission. Registration of an investment adviser does not imply any level of skill or training.
Acadian Asset Management (Singapore) Pte Ltd, (Registration Number: 199902125D) is licensed by the Monetary Authority of Singapore.
Acadian Asset Management (Australia) Limited (ABN 41 114 200 127) is the holder of Australian financial services license number 291872 (“AFSL”). Under the terms of its AFSL, Acadian Asset Management (Australia) Limited is limited to providing the financial services under its license to wholesale clients only. This marketing material is not to be provided to retail clients.
Acadian Asset Management (UK) Limited is authorized and regulated by the Financial Conduct Authority (‘the FCA’) and is a limited liability company incorporated in England and Wales with company number 05644066. Acadian Asset Management (UK) Limited will only make this material available to Professional Clients and Eligible Counterparties as defined by the FCA under the Markets in Financial Instruments Directive.

