Link para o artigo original: https://www.man.com/insights/road-ahead-preparing-for-equity-drawdowns
March 31, 2025
Drawdowns are inevitable. They will hurt. Five ruminations ahead of time to remove (a bit of) the sting.
Napoleon may have said that genius was doing the average thing when everyone around you is losing their minds. As set out in prior articles, I don’t trust the legs on this bull. Whether you agree with me or not, given the power of a vigorous drawdown to make you do something really stupid, it’s worth at least some anticipatory reflections. Here are five things that occur to me:
1) It is hard to quantitatively define what a drawdown is
A correction is -10%. A bear market is -20%. But frankly these are numbers which, like 60/40, are entirely made up, although they do have the advantage of being round and big-sounding. Anyone who has tried for themselves to define historic drawdowns based on these thresholds will know the particular headaches of deciding what lookback to use for your trailing maximum, and how much time needs to elapse between drawdowns to make them distinct. A lot of blood, sweat, perhaps even tears, could go into wrestling with those questions. I don’t want to do that, and would rather decide on a sensible-sounding rule, apply it, look at the results and manually override it if it looks stupid.
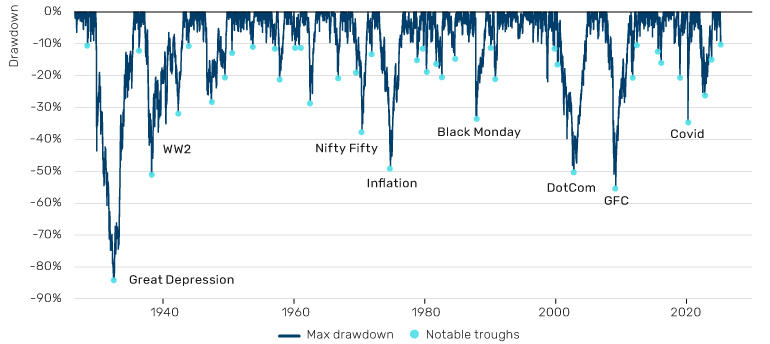
Figure 1 shows my effort to do this, yielding 43 such events, or one every 2.3 years. I’ve labelled the famous ones. This will give us a foundation for the points that follow, but there’s an important observation in this process. As with recessions, we like to imagine a big machine, on which a green light flicks to red. The reality: some folks got together in a room and made it up. Drawdowns are like beauty: there’s no agreed-upon definition, but you’ll know it when you see it. Don’t get hung up on the empirics.
Figure 1. US equity trailing three-year max drawdown, daily periodicity

Source: Daily equity data from Kenneth French, drawdowns defined by Man Group, as of 21 March 2025.
2) Drawdowns come in different shapes
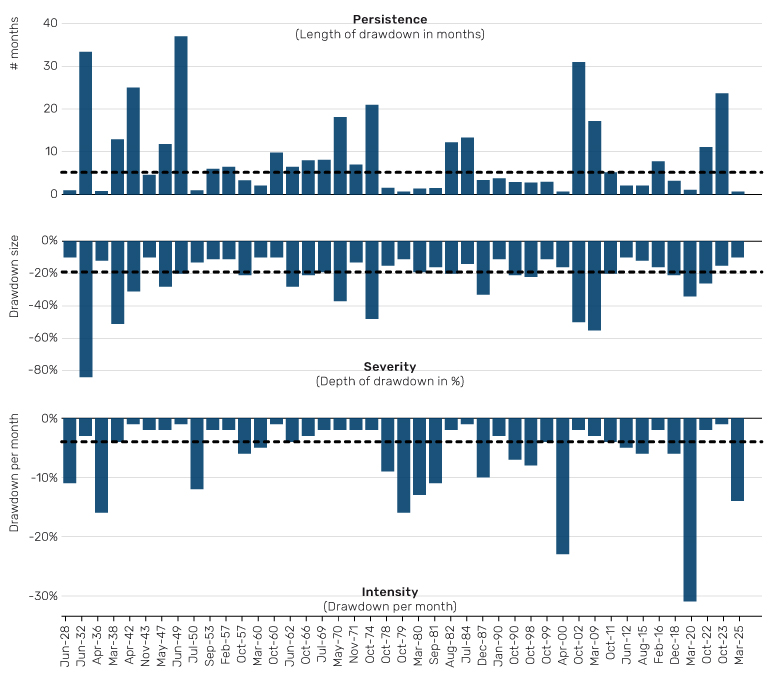
This should already be evident eyeballing Figure 1, but in Figure 2 I give some hard numbers to emphasise this differentiation. The dates on the x axis correspond to the aqua blue circles in Figure 1.
Drawdowns are generally short: five months on average, with 74% less than a year and 84% shorter than 18 months. Even if we did reach the two-and-a-half year mark, as rare downturns have, investors should steel themselves. The pain won’t last forever.
The second panel is broadly a mirror image of the first. In other words, the more persistent the drawdown, the more severe. Severe is not synonymous with intense, which is what the third panel demonstrates (i.e. panel two divided by panel one). On this basis the COVID sell-off was the most intense ever – 31 percentage points per month. The Great Depression (3) is a distant twenty-sixth. Also worth noting that, if we assume (hope?) that 13 March 2025 was the nadir of the most recent drawdown, it would be the fifth most intense in this dataset. You were not over-sensitive to think it stung.
Now I am not at all suggesting that the current drawdown is anywhere near as painful as the Great Depression. But the point is that there is some trade-off between a drawdown which is longer and more gradual, and one that is shorter and sharper. Do you prefer the pain of the 800 metres or that of a marathon? There’s no right answer, both hurt in different ways and it depends on psychology. Know thyself.
Figure 2. Length, depth and intensity of drawdowns highlighted in Figure 1

Source: Man Group, per Figure 1, as of March 2025.
3) The relationship between drawdown and volatility
The average drawdown event is a 2.9 sigma move. The current drawdown is normal. The bad ones are up toward five. COVID, 9, was an aberration (Figure 3).
Figure 3. Drawdown divided by equivalent periodicity volatility (trailing at the market peak)
Problems loading this infographic? – Please click here
Source: Man Group, as of March 2025.
4) What protects in drawdowns?
Thinking about equity drawdown hedges is complicated by the fact that many other market data series only have significant history on a monthly periodicity, while many drawdowns, particularly the shorter, sharper kind, are intra-month. As a work-around, I aggregate into months containing more than 10 drawdown days, and convert to working with monthly data. This is by no means a perfect approach, but it does allow for some important observations.
In Figure 4, I show the performance (navy blue bars) of an equal-weight portfolio of the following equity hedge assets: Quality long/short (L/S), precious metals, US 10-year Treasuries (UST10) and the Swiss franc (CHF) / Australian dollar (AUD) pair (as a proxy for a defensive versus a cyclical currency). The number of drawdown episodes is now reduced to 35, because some of the closer proximity events of Figure 1 merge into one another. The aqua blue bars show the performance of a portfolio that is 75% equity and 25% the hedge basket.
First observation, the hedges broadly work. In 80% of instances (28 of 35), the equal-weight basket is positive. But secondly, there is a feeling of inadequacy, in that the hedge return is anaemic compared with the equity loss. One of those freebie umbrellas. Indeed, the equityhedge combination ends up losing money in all but one instance.
Figure 4. Performance of potential hedges in equity drawdowns
Problems loading this infographic? – Please click here
Source: Quality L/S is represented by AQR QMJ, precious metals is gold and silver from Global Financial Data, UST10 and currency pairs also from Global Financial Data, as of March 2025.
Figure 5 shows the individual components of the hedge basket. Third observation: Quality’s record is unblemished, but it is also the most susceptible to ambiguity of construction. By which I mean that the difference between balance sheet robustness and earnings estimate variability – to take two commonly-used Quality indicators as an example – can be large. Finally, Treasuries, more often than not, work as an equity hedge in a crisis, even in a world of positive stock-bond correlations. We’re all fretting about the post-2020 environment, where we no longer have the diversification benefit between two fundamental portfolio building blocks. That could be true in the body of the distribution, but we can perhaps breathe a little easier in the equity left tail.
Figure 5. Performance of individual hedge components aggregated across the drawdown episodes in Figure 4
Problems loading this infographic? – Please click here
Source: As per Figure 4. Def (vs) Cyc FX proxied by CHF/AUD, as of March 2025.
What predicts drawdowns?
If I could actually answer this I’d be on a beach in Mustique. Actually, I’d prefer a beach in the north of Scotland, but you get the idea. I don’t know, no-one knows. All I would say is that, usually, on the eve of a drawdown, at least one indicator is usually very off.
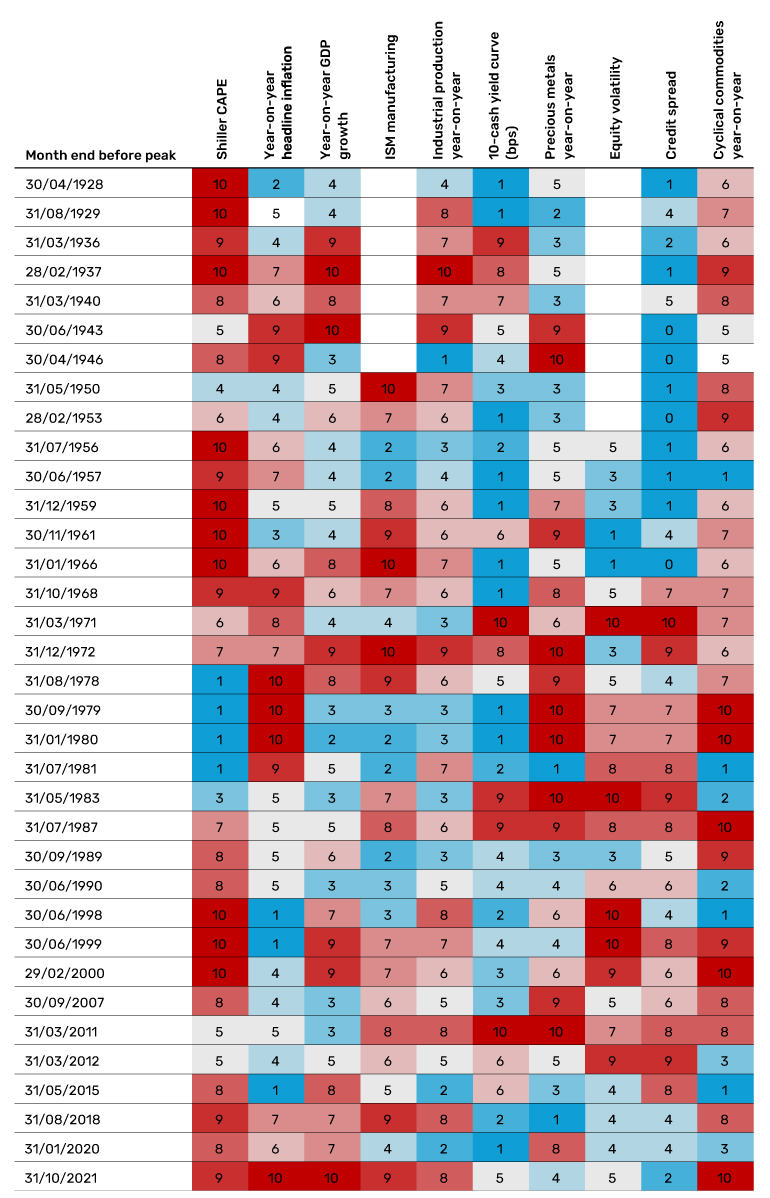
In Figure 6 I show 10 market or economic indicators which, as a practitioner, I often use to take the temperature. The numbers in the body of the table show the decile, relative to trailing 25 years, that the indicator stood at on the eve of the 35 drawdown periods of Figure 4. In 83% of instances, one of the 10 is either top or bottom decile. In 97% of cases there exists a top or a bottom quintile.
Hindsight bias creeps in of course, but I think it’s fair to say these dragons don’t come completely out the blue.
Figure 6. Decile ranking (trailing 25 years lookback) of 10 key economic and market indicators

Source: Bloomberg, Shiller, Global Financial Data. Note that all series use 25-year trailing percentiles, with the exception of the ISM manufacturing PMI which uses the full history due to it being a bounded variable. Equity volatility is average of trailing and implied, once the VIX starts trading in 1990. Data as of March 2025.
This information herein is being provided by GAMA Investimentos (“Distributor”), as the distributor of the website. The content of this document contains proprietary information about Man Investments AG (“Man”) . Neither part of this document nor the proprietary information of Man here may be (i) copied, photocopied or duplicated in any way by any means or (ii) distributed without Man’s prior written consent. Important disclosures are included throughout this documenand should be used for analysis. This document is not intended to be comprehensive or to contain all the information that the recipient may wish when analyzing Man and / or their respective managed or future managed products This material cannot be used as the basis for any investment decision. The recipient must rely exclusively on the constitutive documents of the any product and its own independent analysis. Although Gama and their affiliates believe that all information contained herein is accurate, neither makes any representations or guarantees as to the conclusion or needs of this information.
This information may contain forecasts statements that involve risks and uncertainties; actual results may differ materially from any expectations, projections or forecasts made or inferred in such forecasts statements. Therefore, recipients are cautioned not to place undue reliance on these forecasts statements. Projections and / or future values of unrealized investments will depend, among other factors, on future operating results, the value of assets and market conditions at the time of disposal, legal and contractual restrictions on transfer that may limit liquidity, any transaction costs and timing and form of sale, which may differ from the assumptions and circumstances on which current perspectives are based, and many of which are difficult to predict. Past performance is not indicative of future results. (if not okay to remove, please just remove reference to Man Fund).


