Link para o artigo original: https://www.man.com/maninstitute/trend-following-loading-the-dice

Pairing trend-following with long-short quality strategies can bolster portfolio defences against sudden market volatility, addressing the challenges of relying on trend-following alone.
November 2024

“Trend-following has historically performed well during more sustained drawdowns. However, performance over shorter and more volatile episodes is akin to a roll of the dice.”
Practitioners have often touted trend-following strategies as being ‘long volatility’1 . While this statement may hold true when evaluated over weeks or months, it can cause confusion during sudden, short-lived volatile periods, such as the collapse of Silicon Valley Bank in March 2023 and the yen carry trade unwind in August this year. In both instances, we saw a rapid increase in volatility (as represented by CBOE Volatility ‘VIX’ Index), sharp reversals across markets and the underperformance of trend-following strategies.
The key issue is the sharpness of volatility spike. Trend-following has historically performed well during more sustained drawdowns, lasting months or longer. However, performance over shorter and more volatile episodes is akin to a roll of the dice and depends on how the strategy is positioned at the onset of the volatility.
These events highlighted the limitations of trend-following as a first line of defence in portfolios. To address this, combining trend-following with complementary strategies like long-short quality can provide more reliable protection and enhance portfolio defensiveness. In this paper, we explore how these strategies can work together effectively.
Rolling the dice
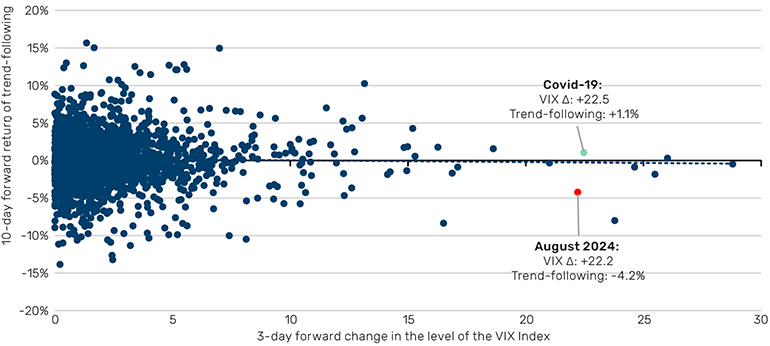
Figure 1 highlights the unpredictability of trend-following returns during sudden volatility shocks. We plot the 3-day forward change in the level of the VIX volatility index against the forward 10-day return of the Société Générale (SG) Trend Index—an index of ten trend-following managers designed to be representative of the managed futures space—dating back to 2000. We opt for a 3-day window for the VIX index as it aligns with the duration of the volatility spike in August, and a 10-day window for the SG Trend Index, as this is typically much shorter than the trends the trend-following industry attempts to capture.
Figure 1: Trend-following performance during volatility spikes

Source: Société Générale and Bloomberg; between 1 January 2000 to 31 August 2024. Trend-following represented by SG Trend Index.
“The dice are loaded in trend-following’s favour when the initial volatility spike is followed by a protracted window of deleveraging across markets.”
At first glance, it is obvious that trend-following performance during rapid volatility spikes follows no discernible pattern. For instance, the initial VIX spike during the Covid-19 outbreak in March 2020 (green dot in Figure 1) was profitable for trend-following, with the SG Trend Index gaining +1.1% as a result of long fixed-income and US dollar positions. In contrast, in August 2024 (red dot in Figure 1), trend-following performance was sharply negative (-4.2%), with long stocks and US dollar positions being the main culprits. As we said, a roll of the dice.
Where the dice are loaded in trend-following’s favour, however, is when the initial volatility spike is followed by a protracted window of deleveraging across markets, à la the Dotcom bubble and the Great Financial Crisis. Here, trend-following comes into its own, with its ‘crisis alpha’ properties and observed positive skew (as discussed in a previous paper) generating a worthy second line of defence in portfolios.
Loading the dice
But what about a first line of defence? Option-based strategies, such as a rolling long put, fit the bill but they are expensive. We propose a long-short quality cash equity strategy, which we have highlighted before. Intuitively, these strategies should benefit during a sudden sell-off in risk assets, which generates a ‘flight-to-quality’ effect in markets.
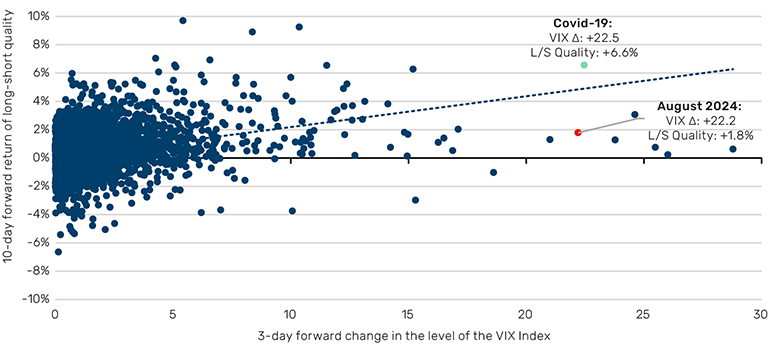
To illustrate this, we replicate the analysis of Figure 1 to observe the 10-day forward performance of a long-short quality strategy2 from the onset of the same 3-day duration volatility spikes. As we noted here, the strategy has been constructed in a dollar-neutral way, which results in a negative correlation to equities. While this negative equity beta undoubtedly contributes to performance during a ‘flight-to-quality’ event, we find that an internally constructed beta-neutral strategy exhibits positive convexity over the same 10-day window following a volatility spike.
Figure 2: Performance of long-short quality during volatility spikes

Source: AQR Capital Management and Bloomberg; between 1 January 2000 to 31 August 2024. Long/Short Quality represented by QMJ Global Daily Returns.
In contrast to the observations made for trend-following, sudden increases in volatility typically benefit long-short quality strategies, which profited during both the Covid-19 and August 2024 events.
Beating the house
Figure 1 suggests that the vulnerability of trend-following may be dependent on how the strategy is positioned coming into the spike, or more specifically, whether it is positioned to benefit from a ‘flight-to-quality’ event or not.
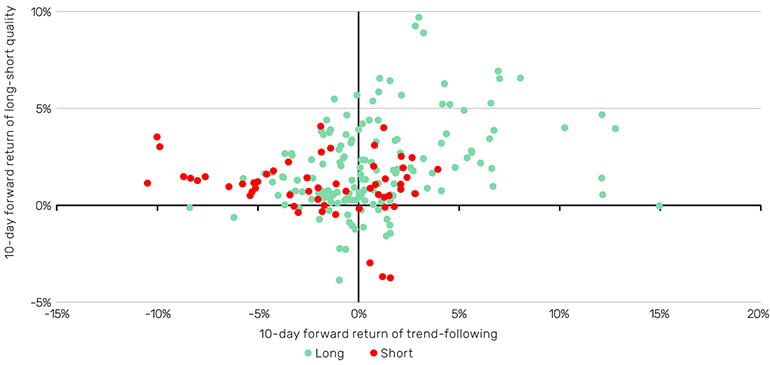
Assuming that bond positioning is a key determinant here, in Figure 3 we plot the 10-day forward performance of long-short quality and trend-following strategies during the periods where the VIX has increased by five points or more (97th percentile of moves) over the same 3-day window. The points are then colour-coded based on whether trend-following is long and short on bonds prior to the spike.
Figure 3. Performance of long-short quality and trend-following during volatility spikes, conditional on how trend-following is positioned in bonds prior to the spike

Source: Société Générale, AQR Capital Management and Bloomberg; between 1 January 2000 to 31 August 2024. Long/Short Quality represented by QMJ Global Daily Returns. Trend-following represented by SG Trend Index. Trend-following positioning based of Société Générale’s SG Trend Indicator.
“While leaving things to a roll of the dice may appeal to some, those seeking more certainty could consider a long-short quality strategy to supplement trend-following.”
Straight away, we can see that long-short quality strategies are well-suited as a first line of defence, with positive returns in nearly 90% of cases. In contrast, trend-following is positive only half the time, with an average return of 0.1%. What drives this uncertainty becomes clearer when we consider how trend-following is positioned coming into a spike, with the average return increasing to 0.9% when the strategy is long bonds, compared to a loss of 2.0% when it is short. This is intuitive as during a ‘flight-to-quality’ event investors flock to safe-haven assets, such as bonds. Of course, bonds are not the only potential explanatory variable here; positioning in other safe-haven assets, such as the US dollar, will likely also play a part, as would trend-following’s overall equity beta.
Ensuring that trend-following is positioned the right way, however, is unfeasible. While leaving things to a roll of the dice may appeal to some, those seeking more certainty could consider a long-short quality strategy to supplement trend-following and bolster defensiveness. For those looking to load the dice further, adjusting allocations based on how defensively trend-following is positioned can enhance strategic advantage, turning chance into calculated opportunity.
All data Bloomberg unless otherwise stated.
1. Fung, W., and D. Hsieh, “Empirical Characteristics of Dynamic Trading Strategies: The Case of Hedge Funds”, The Review of Financial Studies, 2, 275-302.
2. Asness, Cliff S. and Frazzini, Andrea and Pedersen, Lasse Heje, Quality Minus Junk (June 5, 2017). Available at SSRN: https://ssrn.com/abstract=2312432 or http://dx.doi.org/10.2139/ssrn.2312432. Daily returns available at https://www.aqr.com/Insights/Datasets
This information herein is being provided by GAMA Investimentos (“Distributor”), as the distributor of the website. The content of this document contains proprietary information about Man Investments AG (“Man”) . Neither part of this document nor the proprietary information of Man here may be (i) copied, photocopied or duplicated in any way by any means or (ii) distributed without Man’s prior written consent. Important disclosures are included throughout this documenand should be used for analysis. This document is not intended to be comprehensive or to contain all the information that the recipient may wish when analyzing Man and / or their respective managed or future managed products This material cannot be used as the basis for any investment decision. The recipient must rely exclusively on the constitutive documents of the any product and its own independent analysis. Although Gama and their affiliates believe that all information contained herein is accurate, neither makes any representations or guarantees as to the conclusion or needs of this information.
This information may contain forecasts statements that involve risks and uncertainties; actual results may differ materially from any expectations, projections or forecasts made or inferred in such forecasts statements. Therefore, recipients are cautioned not to place undue reliance on these forecasts statements. Projections and / or future values of unrealized investments will depend, among other factors, on future operating results, the value of assets and market conditions at the time of disposal, legal and contractual restrictions on transfer that may limit liquidity, any transaction costs and timing and form of sale, which may differ from the assumptions and circumstances on which current perspectives are based, and many of which are difficult to predict. Past performance is not indicative of future results. (if not okay to remove, please just remove reference to Man Fund).

