
Link para o artigo original: https://www.man.com/insights/portable-alpha-solving-magnificent-problem

Can investors challenge the Mag Seven and live to tell the tale? We argue they can, through portable alpha solutions.
Introduction
The rise of the Magnificent Seven1 has proved a major headache for stock pickers. The largest stocks, primarily dominating one sector, are already overweight in most indices simply because of index design. How does one beat that?
In this article we illustrate how a portable alpha framework can help to tackle the Magnificent Seven problem through diversification. Separating an investor’s value-add, the ‘alpha’, from a market factor, the ‘beta’, can help to move the battleground away from stocks towards areas where an investor possibly has a greater edge. We examine some of the consequences of selecting the “alpha” component, and outline the potential implications.
Spoiler alert: we can stand up to the Magnificent Seven and survive to tell the tale.
The magnificent problem
In our recent article, If It Moves, Monetise It! we argued that by combining a stocks portfolio with a trend-following strategy it is possible to double returns without introducing more risk. This is a prime example of a “portable alpha” strategy.
In a nutshell, portable alpha strategies divide an investment into a beta component, representing market exposure of some sort, and an uncorrelated “alpha” component. The “portable” element originates from this separation; the investor is not constrained by the asset class of the beta component and is free to “port” the alpha wherever they see fit.
The rise of the Magnificent Seven, and the myriad challenges their dominance poses to fund managers, provide a timely context to explore the application of portable alpha strategies. A stock-picker’s role can be viewed as comprising a beta component, the index, and a series of over- and under-weights – the “alpha”, in this case. Framed this way, the beta component can be easily replicated by an index future or total return swap, generating exposure in a cheap and efficient manner. Owing to the efficiencies of trading on margin, this frees up the majority of the investment for the alpha component.
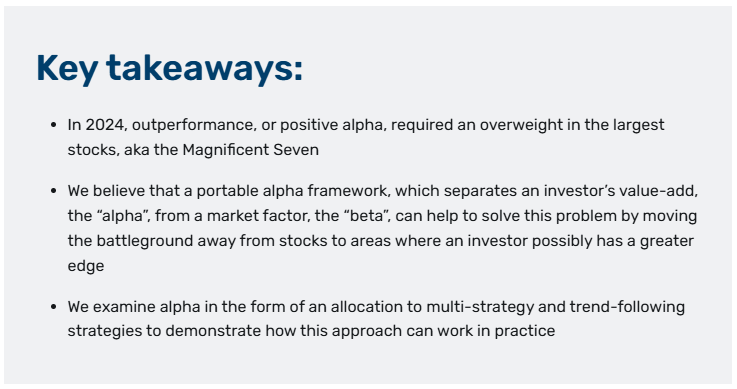
In 2024, outperformance, or positive alpha, required an overweight in the largest stocks, concentrated in one sector, aka the Magnificent Seven – an approach a risk manager might not be happy with. Further, selecting a small number of expensive stocks cannot be the key to success for stock pickers in the long term. This is likely the reason that many of our recent client conversations have been about improving performance in light of significant underperformance of active equity portfolios in 2024.
How can portable alpha help?
By separating alpha from beta, we can diversify the alpha source. Specifically, in the case of the Magnificent Seven, portable alpha facilitates alpha sources from outside of equities, thereby enabling us to move away from stock picking. In this regard, we examine alpha in the form of an allocation to multi-strategy and trend-following strategies.
In Figure 1 we examine three portfolios, one of which is a vanilla equities investment, and two simulated portable alpha versions featuring the same equities exposure. We choose the S&P 500 Index as our benchmark as it characterises the Magnificent Seven problem.
Portfolio 1 (P1): Our vanilla investment, the S&P 500 Index
Portfolio 2 (P2): S&P 500 Index future + multi-strategy hedge fund2
Portfolio 3 (P3): S&P 500 Index future + trend-following strategy3
We assume that the margin on the S&P 500 Index future is 10%, and the margin on each alternatives allocation is 25%. We will touch on the significance of margin shortly.
Figure 1. Notional and exposure profiles for P1, a vanilla equity portfolio, and P2 & P3, two portable alpha portfolios featuring multi-strategy and trend-following approaches respectively. Each has equivalent equity exposure
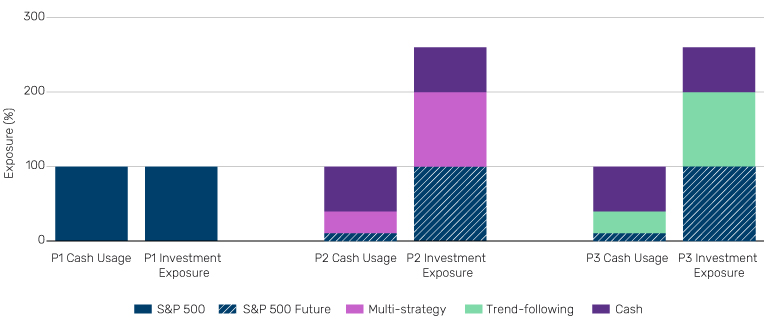
Source: Man Group database, as of 31 December 2024. Illustrative examples, for information purposes only. See notes on “Hypothetical Results” and “Simulated Performance” at the end of this document.
The account curve and drawdown profiles for all three portfolios are shown in Figure 2, and statistics are in Table 1. We assume 25 basis point (bps) per annum trading costs on the beta component.
Figure 2. Performance (top), drawdown (bottom) of our vanilla equity portfolio P1 (green), with our two portable alpha portfolios featuring the equivalent equity exposure, as per Figure 1
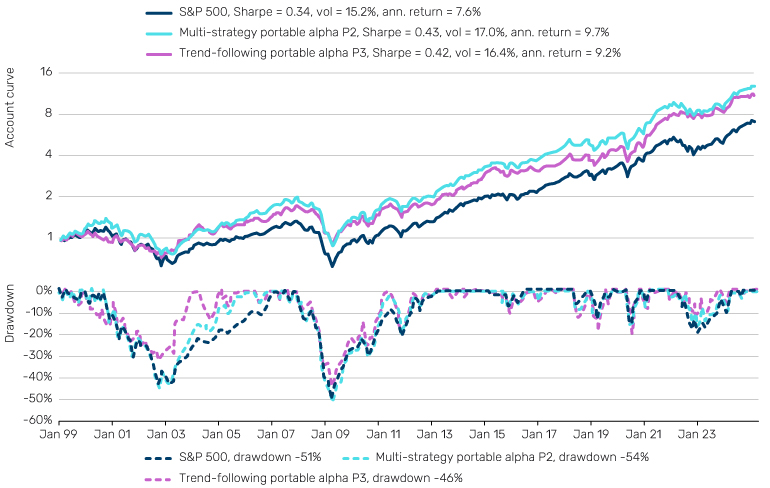
Source: Man Group database, HFR, Barclay Hedge. Date range 1 January 1998 to 31 December 2024. Illustrative examples, for information purposes only. See notes on “Hypothetical Results” and “Simulated Performance” at the end of this document.
We see that the portable alpha solutions generate higher returns over time despite having the same beta component, the 100% S&P 500 allocation. In simple terms, this is because we have two dollars invested for every one dollar in our traditional portfolio, and our ‘alpha’ components, multi-strategy and trend-following, both generate positive returns over time. Further, the volatility of our solutions are not materially higher than the original 100% S&P 500 portfolio. This, of course, is because of the diversification provided by our alpha strategies. Combine these two points and we can understand the improved Sharpe ratios of the portable alpha solutions over the original portfolio.
Outside of the movies, references to the Magnificent Seven as we know them today began in Q2 2023. Table 1 shows that performance of our portable alpha strategies are comparable to those of the S&P 500 since the inception of the Magnificent Seven, and also over full year of 2024.
Table 1. Performance of portable alpha components, and portfolios of Figure 1
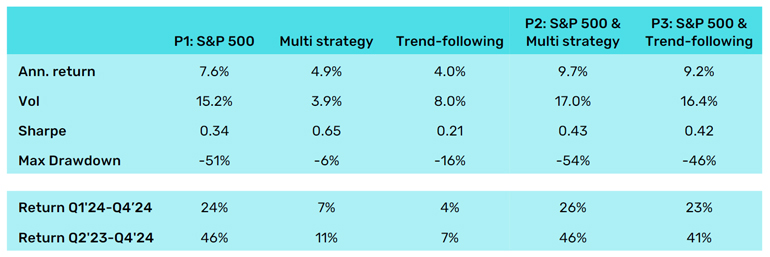
Source: Man Group database, HFR, Barclay Hedge. Date range 1 January 1998 to 31 December 2024. . Illustrative examples, for information purposes only. See notes on “Hypothetical Results” and “Simulated Performance” at the end of this document.
Drawdown profiles, in the lower panel of Figure 2, are a little more nuanced. Our multistrategy portable alpha portfolio has a marginally worse drawdown than the S&P 500’s (-54% versus -51%). The trend-following solution, however, has a smaller drawdown (-46%) because of trend’s famous ‘crisis alpha’ property which, in this case, translates into ‘may offer performance when the S&P doesn’t’. The value of having trend-following sitting alongside conventional portfolios is something that we have written about on numerous occasions (see: Trend-Following: What’s Not To Like).
Potential drawbacks
Tracking error
So far, so good. A frequent complaint about portable alpha strategies is that they increase tracking error versus the original beta portfolio. We quantify this in Figure 3 by examining the tracking error of our multi-strategy and trend-following alpha allocations to the S&P 500.
Figure 3. S&P 500 (top panel), and tracking error of multi-strategy (blue) and trend-following (yellow) to S&P 500 (lower panel)
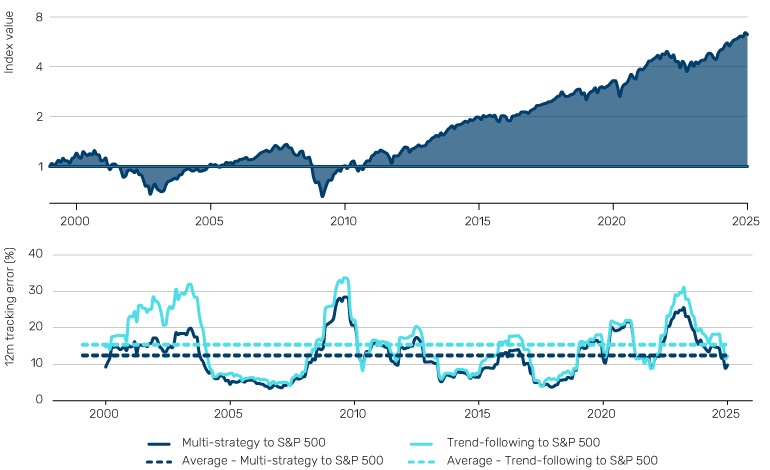
Source: Man Group, MSCI and Bloomberg; between 1 January 1987 to 31 December 2024. Illustrative examples, for information purposes only. See notes on “Hypothetical Results” and “Simulated Performance” at the end of this document.
The tracking error of our multi-strategy index to the S&P 500 on a rolling 12-month basis is around 12% on average, at its lowest (~4%) during equity market rallies such as those leading up to the Global Financial Crisis in 2008, but peaks during drawdowns in the equity index. As we see from Figure 3, however, this peak tracking error is largest when the portable alpha portfolio outperforms. This effect is amplified when we use the trendfollowing index instead of multi-strategy; during equity drawdowns tracking error increases more, but again this is due to outperformance, when trend-following’s crisis alpha property kicks in.
Cash efficiency and liquidity considerations
In the preamble to Figure 1, we outlined our margin assumptions. Portable alpha, as a framework, is predicated on cash efficiency and the use of derivatives.
Most beta components can be replicated cheaply and cash efficiently with a derivative — in Figure 1 this is an S&P 500 future — leaving room to fund the alpha component. The cash efficiency of the alpha component is also important. If margin on the beta component is 10%, say, we have 90% left to fund our alpha component, so we do require some degree of cash-efficiency if we are to fund an 100% alpha exposure. More often than not, however, our alpha component is also cash efficient. Trend-following, for example, tends to use futures markets to gain their exposure and typically requires only around 25% margin.
Liquidity plays a significant role too. Sod’s Law dictates that margin requirements are most likely to rise when markets are volatile, which is often when the alpha component is needed most. Ideally, if enough cash buffer is factored into the portable alpha solution, there should be no issues. However, a worse scenario might occur if the alpha component is sufficiently illiquid that it can’t be sold down in the event of a margin call, leading to the enforced selling of the beta component. We discussed this in a previous note. Investors need to know whether a chosen alpha strategy will pass this liquidity test. Ideally the strategy has ‘been there and done that’.
Surviving the Magnificent Seven
In the original movie, only three of the seven survived. We are not about to make any bold predictions as to the fate of the current incarnation, nor about what might eventually take their place. What we will say is similar threats to stock pickers will likely emerge in the future.
We have shown how portable alpha strategies can potentially solve the problem that the Magnificent Seven currently poses to stock pickers, but the concept holds broadly. Diversification and cash efficiency are key. We have concentrated here on different aspects of diversification, and some implications of this choice. Cash efficiency, related to margin as discussed above, is another potential dimension, which impacts the choice of beta, plus how much leverage could potentially be deployed in the alpha component, a topic we will explore in greater depth in future notes.
1. Apple, Microsoft, Alphabet, Amazon, Nvidia, Meta, and Tesla.
2. Represented by 40% HFRI Equity Mkt Neutral, 40% HFRI Macro Systematic Diversified, 20% HFRI Relative Value Multi Strategy.
3. Represented by BTOP50 Index of 20 predominantly trend-following managers (‘BTOP50’).
Bibliography
Robertson, G. (2023), “Trend-Following: If it Moves, Monetise it!”, Man Institute, Available at: https://www.man.com/maninstitute/trend-following-if-it-moves-monetise
Robertson, G. (2023), “Trend-Following: What’s Not to Like?”, Man Institute, Available at: https://www.man.com/maninstitute/trend-following-what-not-to-like
Robertson, G. (2020), “We See Risk Where Others May Not: Managing Beta Exposures in Portable Alpha Strategies”, Man Institute, Available at: https://www.man.com/maninstitute/managing-beta-exposures
Disclaimer
Simulated Performance
Simulated performance is not indicative of future results. Returns may increase or decrease as a result of currency fluctuations.
The performance, volatility and/or other information on the portfolios is simulated. The simulation has been created by ‘back testing’ a systematic trading model to historic data. Since the trades have not been executed, the published results may have under-or-over compensated for the impact, if any, of certain market factors, such as lack of liquidity. The synthetic track record is subject to change without notice as models develop over time.
Hypothetical Results
Hypothetical Results are calculated in hindsight, invariably show positive rates of return, and are subject to various modelling assumptions, statistical variances and interpretational differences. No representation is made as to the reasonableness or accuracy of the calculations or assumptions made or that all assumptions used in achieving the results have been utilized equally or appropriately, or that other assumptions should not have been used or would have been more accurate or representative. Changes in the assumptions would have a material impact on the Hypothetical Results and other statistical information based on the Hypothetical Results.
The Hypothetical Results have other inherent limitations, some of which are described below. They do not involve financial risk or reflect actual trading by an Investment Product, and therefore do not reflect the impact that economic and market factors, including concentration, lack of liquidity or market disruptions, regulatory (including tax) and other conditions then in existence may have on investment decisions for an Investment Product. In addition, the ability to withstand losses or to adhere to a particular trading program in spite of trading losses are material points which can also adversely affect actual trading results. Since trades have not actually been executed, Hypothetical Results may have under or over compensated for the impact, if any, of certain market factors. There are frequently sharp differences between the Hypothetical Results and the actual results of an Investment Product. No assurance can be given that market, economic or other factors may not cause the Investment Manager to make modifications to the strategies over time. There also may be a material difference between the amount of an Investment Product’s assets at any time and the amount of the assets assumed in the Hypothetical Results, which difference may have an impact on the management of an Investment Product. Hypothetical Results should not be relied on, and the results presented in no way reflect skill of the investment manager. A decision to invest in an Investment Product should not be based on the Hypothetical Results.
No representation is made that an Investment Product’s performance would have been the same as the Hypothetical Results had an Investment Product been in existence during such time or that such investment strategy will be maintained substantially the same in the future; the Investment Manager may choose to implement changes to the strategies,make different investments or have an Investment Product invest in other investments not reflected in the Hypothetical Results or vice versa. To the extent there are any material differences between the Investment Manager’s management of an Investment Product and the investment strategy as reflected in the Hypothetical Results, the Hypothetical Results will no longer be as representative and their illustration value will decrease substantially. No representation is made that an Investment Product will or is likely to achieve its objectives or results comparable to those shown, including the Hypothetical Results, or will make any profit or will be able to avoid incurring substantial losses. Past performance is not indicative of future results and simulated results in no way reflect upon the manger’s skill or ability.
This information herein is being provided by GAMA Investimentos (“Distributor”), as the distributor of the website. The content of this document contains proprietary information about Man Investments AG (“Man”) . Neither part of this document nor the proprietary information of Man here may be (i) copied, photocopied or duplicated in any way by any means or (ii) distributed without Man’s prior written consent. Important disclosures are included throughout this documenand should be used for analysis. This document is not intended to be comprehensive or to contain all the information that the recipient may wish when analyzing Man and / or their respective managed or future managed products This material cannot be used as the basis for any investment decision. The recipient must rely exclusively on the constitutive documents of the any product and its own independent analysis. Although Gama and their affiliates believe that all information contained herein is accurate, neither makes any representations or guarantees as to the conclusion or needs of this information.
This information may contain forecasts statements that involve risks and uncertainties; actual results may differ materially from any expectations, projections or forecasts made or inferred in such forecasts statements. Therefore, recipients are cautioned not to place undue reliance on these forecasts statements. Projections and / or future values of unrealized investments will depend, among other factors, on future operating results, the value of assets and market conditions at the time of disposal, legal and contractual restrictions on transfer that may limit liquidity, any transaction costs and timing and form of sale, which may differ from the assumptions and circumstances on which current perspectives are based, and many of which are difficult to predict. Past performance is not indicative of future results. (if not okay to remove, please just remove reference to Man Fund).


