
Link para o artigo original : https://www.man.com/insights/road-ahead-deepfreak

DeepFreak
February 27, 2025
What could make the music stop for technology stocks?
“You’re uncategorical
A fuel burning oracle!
A fantasmigorical machine!
You’re more than spectacular!
To use the vernacular
You’re wizard! You’re smashing! You’re key!”
Chitty Chitty Bang Bang (1968)
There is little new about machine anthropomorphism. Something about the meat computer, it seems, gets very excited about the actual computer. But an exciting technology is not always an exciting investment. And 2025 so far has provided some shots across the bow, particularly in relation to the events of 27 January, when the seeming frugality of DeepSeek’s training costs caused tremors in the tech capital expenditure bonanza. Now’s a good moment to take stock and consider if the breakthroughs of DeepSeek could catalyse a market DeepFreak.
Valuation
A great business bought at the wrong multiple is a losing bet. Words to that effect are one of the first lessons a budding equity analyst learns. The usual example is Cisco Systems which, if bought in March 2000, would have been in the red as recently as October last year. This is despite growth in earnings per share (EPS) through that time of over 6% a year, ahead of the broader S&P 500 Index. The catch: you paid a 140x multiple.
The DotCom parallel is hackneyed, but clichés are useful sometimes, and this one might be all we’ve got. There have only been two other US equity bubbles in the last 100 years (the ‘roaring twenties’ and the ‘nifty fifty’), and both were much more broadly dispersed, covering sectors as variant as railroads, consumer goods, automobiles and financials, as well as nascent technologies. The DotCom bubble was different in terms of its concentration of performance around internet innovation. In the two-and-a-half years between March 2000 and September 2002, the MSCI USA Technology Index ran at a compound annual growth rate (CAGR) of -48%. Communication Services was -43%. The next steepest decliner (Consumer Discretionary) was only half that. Staples (+7%) and Real Estate (+5%) were positive. The present iteration, if we are to call it a bubble, has likewise been concentrated around technological advance. Decade-to-date, the Magnificent Seven have yielded an annualised total return of +43%. The remaining 493 stocks in the S&P 500 Index have delivered less than +11%. A sample size of one makes a statistician feel uncomfortable, but when it’s all you’ve got, even that thin gruel can be worthy of study.
So then, the question becomes, how near a comparison is it? Valuation suggests a close one. The S&P 500 on a 12-month forward price-to-earnings (PE) basis is 22x. 35 years of history yields only two equals: 2020/21 (peak of 23x) and 1999/2001 (26x). On Shiller PE it is 38x. 150 years of data gives the same two comparators: 2021 (39x) and 1999/2001 (44x).
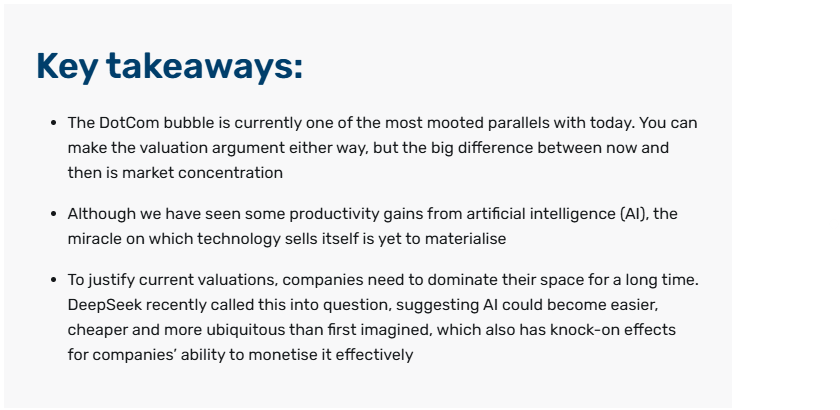
Another oft-used lens is to look at valuation of only the top tech names, as the rally’s bellwethers. This approach is more favourable to the current juncture, which is perhaps why the bulls cling to it. But, in my view, such optimism can be overplayed. Figure 1 shows the average 12-month forward multiple for the top five tech stocks by market cap in the six years 1997 to 2002, as well as the same period back from today. We annotate with the peak multiple for each constituent. It is true that the 1997-2002 line is bubble-shaped in a way in which the today line is not, created to a large degree by the run-up in Cisco and Oracle through 1999. At the same time, bubbles take many forms and are not always the inverse-V of financial folklore.1 The aqua blue line of Figure 1 is above the navy blue 81% of the time. In my view, there’s scope for the markets historian of 2050 to look back on this chart and say, ‘those are two different, but equally silly lines’. Although perhaps I flatter myself that this will be their reading of choice.
Figure 1. Top five tech companies 1997-2002 and 2019-2024, average 12-month forward price-to-earnings multiple
Source: Bloomberg, Man Group calculations, as of February 2025.
Exaggeration
Be honest, 24 months ago, you had never heard of Roy Amara. But now you’re namedropping his eponymous rule with the breezy air of one well-steeped in the annals of futurology.2 So perhaps it’s just an easy line for a bear to cling to. Even so, I think it’s worthy of consideration.
A common line around the advent of ChatGPT in late 2022 was, “the historical lag between innovation and killer app is 18 to 24 months”. By my count we’re at 27 and… there’s at least a case for the prosecution who say it’s Godot. Tell this to an AI-apostle and they will often respond with a chart showing large language models’ (LLM) daily active users (DAUs) today, versus Facebook DAUs in the early 2010s. One of those one-line-over-another classics. I don’t find this a particularly enlightening comparison. Facebook back then was one (barring a few weirdos on MySpace), LLMs today are many. Moreover, social media even at its genesis required a level of engrossment from each DAU, greatly in excess of an LLM. Early doors you gave it your embarrassing photos, your political temperament, your softly flirtatious pokes. On the other hand, a cynic might say that all you give to GPT are your winged homework assignments and shortcut Google searches.
While we would not be in the extreme indicated by that last sentence, it is empirically undeniable that the productivity miracle on which the technology sells itself, has not yet been experienced, at least in aggregate. A brief history of US productivity: according to the Bureau of Labor Statistics (BLS), it rose by an annual average of 1.8% in the 1970s, followed by 1.5% (80s), 2.3% (90s), 2.8% (00s) and 1.2% (10s). The 20s so far have been 1.9%, comprised of 1.6% and 2.2% pre- and post-GPT. Perhaps a little acceleration, hardly game-changing.
Some will say that one needs to look more narrowly to see the productivity benefits and we would agree that here there is more room for getting carried away. Figure 2 shows the annualised productivity growth (proxied as percent change in sales per employee) of the top 10 constituents of Goldman Sachs’ AI Beneficiaries basket. All have increased efficiency defined in this way, with all but two doing so at a clip of over 5% a year. The sales-weighted average of +16% (the dashed line) is a spine-stiffener for the AI faint hearted. Moreover, if we were to define productivity as the growth in operating income per employee, on average these 10 have gone from a US$7,000 loss to a US$3,500 gain. There’s no percentage for that.
Then again, the narrative of the last 30 months has been more than just AI. Inflation will have flattered top lines. The Tech sector did some heavy-duty personnel blood-letting post 2022. And so on. There’s a good argument either way, but I’d be in the camp that took near-term breathlessness with a pinch.
Figure 2. Annualised growth in sales per employee of Goldman Sachs top 10 AI beneficiaries, from GPT to now
Problems loading this infographic? – Please click here
Source: Bloomberg, Man Group calculations, as of February 2025.
Commoditisation
This is the particular pain point that DeepSeek stuck its finger into. If AI becomes as easy and ubiquitous as gold in the kingdom of Montezuma, does it lose its currency? Put differently, even if the promised productivity boom is real, might it not be shared among so many entities that the benefit to a select group is trivial?
As discussed in our last note,3 if we assume a bull case where the efficiency increase is as profound as the rise of arable farming, the printing press, the opening up of the New World, the Industrial Revolution or the post-WW2 lean manufacturing boom, we might expect a 10-year productivity increase of 3-5% per annum, compared with 1-2% where we are today. Thus in a far-bull case, we might be talking about an increment from here of 300 basis points (bps). On US$30 trillion of GDP, perhaps US$900 billion a year in potential additional revenues. But how narrowly will this pie get divided?
Some market pricing indicates we may be in a ‘who ate all the pies’ paradigm. Figure 3 shows the 10 US Large Cap Tech or Communications companies with the highest multiples. The navy blue bars are the current 12-month forward PE ratios. We then show what the implied figure would be in one (aqua blue), two (pink) and three (purple) years’ time, based on the following two assumptions:
1. The company meets earnings growth estimates forecast by the Street
2. The stock price increases at a tenth of the rate at which it has annualised over the last five years (or since IPO)
These are conservative guardrails. The 10 names have experienced stock appreciation of 45% on average over the last half decade. We assume 5%. The sell-side assumes that earnings growth in the 12 months to February 2027 will be 30% in aggregate, with a further 25% in the 12 months following.4 Those are punchy numbers, but we assume they can be hit.
Figure 3. Implied forward price-to-earnings ratios through time of today’s highest multiple US tech stocks
Problems loading this infographic? – Please click here
Source: Bloomberg, Man Group calculations, as of February 2025.
The three-year implication is 85x on average. Modest in comparison with the 135x we’re on today, but still the kind of number that would make your grandfather choke on his porridge. There may be an argument that obsessing over the multiple is old-fashioned in a world of power laws. But to justify that kind of valuation you still need to dominate your space and keep doing so for a long time. And, to return to the original point, maybe AI isn’t that difficult after all. Really helpful, but widely available, and not conducive to the creation of a new corporate aristocracy. In that eventuality, these multiples could end up as albatrosses.
Monetisation
This is an extension of the last point: can you really cash in? Clearly the detail will depend on the specific vertical you are in; let’s reflect on LLMs as the most visible. While a lot relies on hearsay, a reasonable assumption might be that OpenAI has 10 million individual paying customers, shelling out US$20 a month, and a further one million business clients on US$2,000 a month. So perhaps in the region of US$26 billion annual revenue. That would put your valuation range between 4x sales if you believe Elon Musk, or 12x if you believe Masayoshi Son. Let’s split the difference and call it 8x.
Now that, per Figure 4, is totally normal, even slightly cheap, compared to other large-scale tech businesses with a subscription business model. But this does feel quite incongruous with the level of hype. If it’s just another subscription, albeit a very useful one, why is Jim Cramer losing his mind? Moreover, is there really sufficient uniqueness to each LLM to build enough of a moat around its subscription base? There are already umpteen strangely named chatbots, but there’s only one Excel. We’re back to the commoditisation point.
Figure 4. Price-to-sales ratio for major tech subscription businesses
Problems loading this infographic? – Please click here
Source: Bloomberg, Man Group calculations, as of February 2025.
Perhaps it’s hindsight bias, but to me it feels relatively intuitive how, at the time, you could have imagined the pathways by which e-commerce, internet search or social media could exponentially generate revenue raising opportunities. It is less clear what those channels are for the LLMs. A simple reminder that there are things that have high utility but low profit. Like planes. The average operating margin of MSCI World Airlines Index over the last 15 years is 6.6% if you exclude the 2020-22 COVID years, and 1.3% if you don’t. Neither are Wolf of Wall Street kind of numbers.
Conclusion
We began this piece with the uncategorical fuel-burning oracle that was Chitty. Computer-sentience is usually more evil than cars in pop culture. HAL, Skynet, VIKI, Ultron… and for me there is a risk that this theme does end up eating the wider market, even if not humanity. The big difference between the present excitement and DotCom (and indeed every other historical moment) is concentration. And, indeed, concentration powered by a particular driver. Figure 5 is an excellent chart from Jim Reid at Deutsche Bank, showing the percent of the S&P 500 comprised of the top five companies, annotated with identifiers at particular points. It is not just that the level is 10 points higher than DotCom, but also that all five of the top names are tech (and by the way, so are eight of the top 10, with Berkshire Hathaway and Walmart the only exceptions). And in a social-media enabled world, the extent to which these bellwether names occupy the popular consciousness is perhaps greater. There may therefore be greater reflexivity to this market, and if the storied names stumble, they could bring the whole edifice down with them.
Figure 5. Share of top five companies by market cap in S&P 500
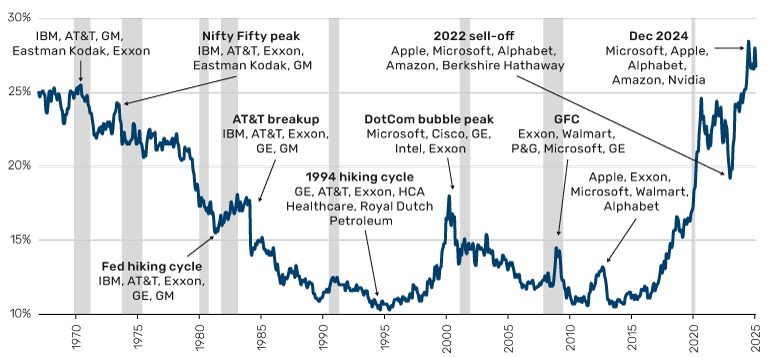
Source: Deutsche Bank, as of 31 January 2025.
1. See: A Brief History of Bubbles: https://www.man.com/insights/a-brief-history-of-bubbles#:~:text=Bubbles%20are%20longer%20than%20they,very%20wide%20dispersion%20of%20durations
2. “We tend to overestimate the effect of a technology in the short run and underestimate the effect in the long run.”
3. See: https://www.man.com/insights/road-ahead-10-for-10-part-2?language_content_entity=en-gb
4. Given that half of these names are forecast to go from red to black in the next 12 months, the average growth rate over the next year is incalculable.
This information herein is being provided by GAMA Investimentos (“Distributor”), as the distributor of the website. The content of this document contains proprietary information about Man Investments AG (“Man”) . Neither part of this document nor the proprietary information of Man here may be (i) copied, photocopied or duplicated in any way by any means or (ii) distributed without Man’s prior written consent. Important disclosures are included throughout this documenand should be used for analysis. This document is not intended to be comprehensive or to contain all the information that the recipient may wish when analyzing Man and / or their respective managed or future managed products This material cannot be used as the basis for any investment decision. The recipient must rely exclusively on the constitutive documents of the any product and its own independent analysis. Although Gama and their affiliates believe that all information contained herein is accurate, neither makes any representations or guarantees as to the conclusion or needs of this information.
This information may contain forecasts statements that involve risks and uncertainties; actual results may differ materially from any expectations, projections or forecasts made or inferred in such forecasts statements. Therefore, recipients are cautioned not to place undue reliance on these forecasts statements. Projections and / or future values of unrealized investments will depend, among other factors, on future operating results, the value of assets and market conditions at the time of disposal, legal and contractual restrictions on transfer that may limit liquidity, any transaction costs and timing and form of sale, which may differ from the assumptions and circumstances on which current perspectives are based, and many of which are difficult to predict. Past performance is not indicative of future results. (if not okay to remove, please just remove reference to Man Fund).


