
Link para o artigo original: https://www.man.com/insights/cooking-up-sharpe
Author(s)


Cooking up Sharpe: A Recipe for Portfolio Construction
March 12, 2025
The quality of a dish lies in its recipe. We explain why portfolio construction follows the same principle.
Introduction
Usually, managing uncertainty isn’t the first thing that springs to mind when you think about preparing a delicious meal. So culinary expert, Anthony Bourdain, was ahead of his time when he said that “food, good eating, is all about risk”. Managing this risk to create a synchronised, balanced whole lies in its recipe – the careful, deliberate combinations that complement each other through precise technique and process.
Portfolio construction follows the same principle: expertly selecting the right investment components and blending them using a robust allocation framework. In this article, we explore the investment recipe – better known as the Z-shift – as a framework for constructing portfolios.
A quick recap on the Z-shift
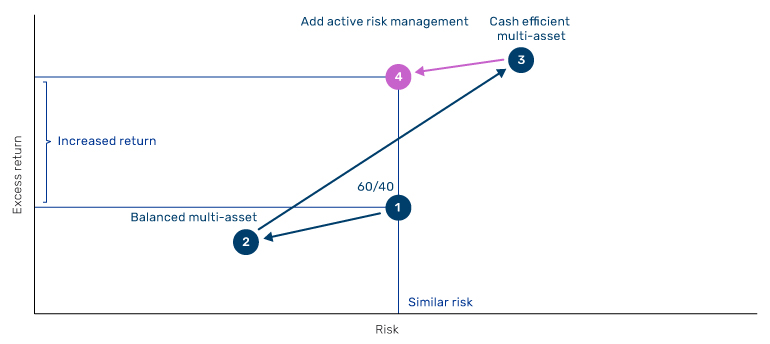
In Dial Up Return Not Risk: The Z-Shift Framework, our colleagues demonstrated how the concepts of diversification, capital efficiency and active risk management can be combined to enhance expected returns while minimising risk – the most crucial optimisation in portfolio theory. As Figure 1 illustrates, at a high level, in step one we diversify to increase the portfolio Sharpe; in step two, we use cash-efficient instruments to scale up returns; and in step three, we introduce active risk management to mitigate downside risks.
Figure 1. Z-shift framework
Source: Man Group Database. Schematic illustration.
Starting point: Beta
Beta (i.e. risk premia) is a key return source for traditional portfolios, providing broad exposure to the underlying market. Equity beta has been the standout over the past 20 years, outperforming numerous other risky asset classes and rewarding its plethora of investors who hold it among the largest allocations in their portfolios.
In most cases, multi-asset investors have paired equities with bonds, benefitting from the negative correlation between the two to shield the portfolio during periods of market stress. The most common implementation of this combination has been the battle-tested 60/40 (or a close variant of it), consisting of 60% global equities and 40% global bonds, both notionally allocated.
Figure 2. Performance of 60/40
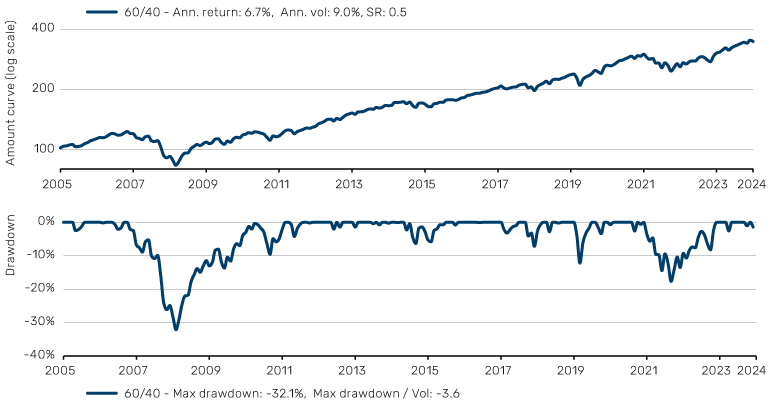
Source: Bloomberg, Man Group Database. 60/40 comprised of 60% MSCI World Equities (hedged USD) and 40% Barclay Global Aggregate Bond Index (hedged USD), rebalanced monthly. Date range: 1 January 2006 to 31 December 2024.
In spite of the commendable long-term return that 60/40 has delivered (Figure 2), the drawdown suggests cause for concern. During periods such as the Global Financial Crisis (GFC) in 2008 and COVID-19 in 2020 when equities struggled, the comparatively higher risk allocation versus bonds meant investors were not sufficiently protected. Indeed, the long-term correlation of a notionally-allocated 60/40 portfolio with 100% equities is approximately 0.98. In other words, 60/40 is effectively an equity proxy.
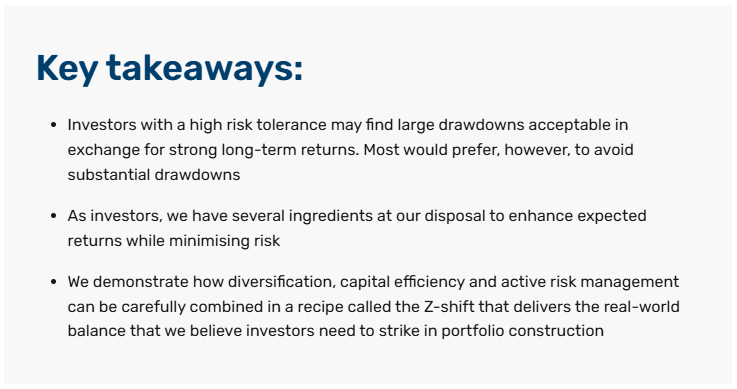
For investors with a large enough risk appetite, the magnitude of these drawdowns may be acceptable given the absolute returns that 60/40 has generated. But most investors would prefer to avoid drawdowns of 30%. That is where the Z-shift comes in.
In step one of our Z-shift, we add other asset classes alongside equities and bonds, which meet the criteria of having similarly positive long-term Sharpe and exhibit low-to-zero correlation. Portfolio allocations are then recalibrated to balance the level of risk between each asset class. The greater diversification increases risk-adjusted returns and lowers volatility, which we can monetise by utilising cash efficient instruments such as futures to gear the portfolio’s return (step two of our Z-shift). As we know, however, diversification can sometimes break down, so step three involves applying three risk-based overlays to dynamically modulate the portfolio in response to evolving market conditions. The goal of this step is to be fully exposed in the good times, but to cut exposure to mitigate risk in the bad times.
Figure 3 compares our initial 60/40 portfolio with that to which we applied our Z-shift – hereafter referred to as ‘Risk-Managed Beta’. Over the long-term, this portfolio outperforms the 60/40 on an absolute and risk-adjusted return basis, with a 0.3 point improvement in Sharpe ratio. Crucially, this was not at the expense of drawdowns or risk; our Risk-Managed Beta portfolio has half the maximum drawdown of 60/40.
Figure 3. Performance of 60/40 and Risk-Managed Beta
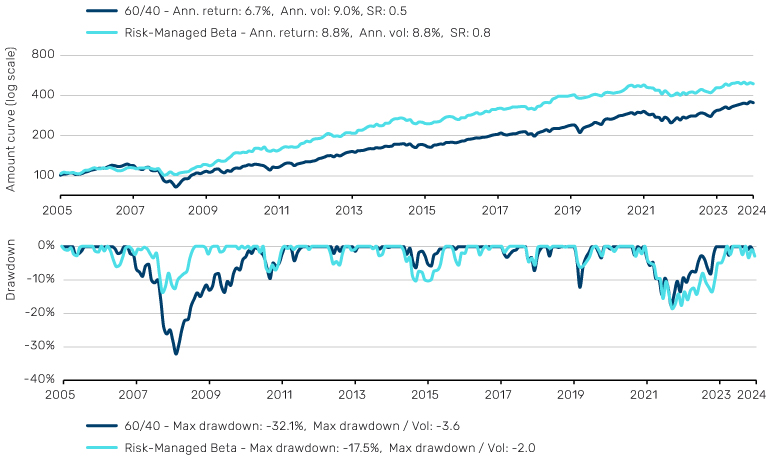
Source: Bloomberg, Man Group Database. Date range: 1 January 2006 to 31 December 2024.
The portfolio Z-shift
Our dish is already looking good, but there are more ingredients at our disposal. The principles of the Z-shift are applicable to portfolio construction more broadly, and we can utilise each of its three steps to transition from the current Risk-Managed Beta portfolio to a diversified, cash-efficient, multi-strategy portfolio.
Step 1: Diversification
Under the constraints of a long-only beta portfolio, we are limited in any further enhancements we can make to improve diversification and Sharpe. However, once we remove these constraints, we are free to pursue the next frontier of diversification – new strategies.
Our philosophy is that these new strategies exhibit robust absolute returns through the body of the beta return distribution, and are diversifying to each other. The four we consider are: equity market neutral, insurance-linked securities (ILS), long/short volatility and an alternative market trend-following strategy, with this specific mix chosen on the basis that it creates a robust blend of signal-driven and market-driven diversification.
From a market diversification perspective, each strategy in this portfolio contributes a unique set of instruments. For example, variance swaps and volatility instruments traded in a long/short volatility strategy, catastrophe bonds traded in an ILS strategy and cash equities traded in an equity market neutral strategy. Alternative trend-following contributes the most from a market-diversification perspective, investing across approximately 400 non-traditional trend-following markets, spanning cash equities to over-the-counter (OTC) derivatives, such as total return swaps, credit default swaps and interest rate swaps, among others. From a signal perspective, the mix of strategies includes a blend of primarily alpha-based, market-neutral, relative value and directional signals.
Figure 4 illustrates that these strategies are, on average, less than 10% correlated to each other, with an average correlation of approximately 20% to the Risk-Managed Beta portfolio.
Figure 4. Correlation matrix of portfolio strategies
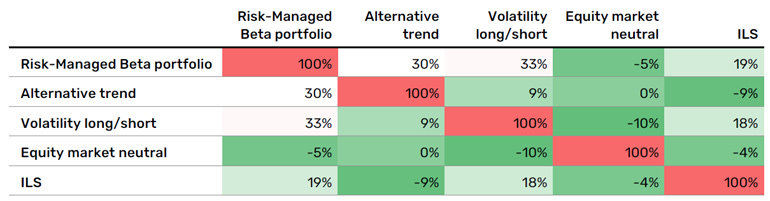
Source: Bloomberg, Man Group Database. Date range: 1 January 2006 to 31 December 2024.
Figure 5 depicts the notional allocations for the new portfolio, which we refer to as Step 1: Diversify. The allocation methodology follows a similar logic to that used in the beta sleeve above, targeting balanced risk between the strategy sleeves. In this case, the notional allocations are set such that we achieve an estimated 50% of risk in the Risk-Managed Beta sleeve and 50% risk in the combination of diversifying strategies.
Figure 5. Allocations of portfolio: Step 1: Diversify
Problems loading this infographic? – Please click here
Source: Man Group Database.
Figure 6 demonstrates the cumulative returns, performance statistics and drawdowns of the Step 1: Diversify portfolio alongside the Risk-Managed Beta and 60/40.
Figure 6. Allocations and performance of all portfolios
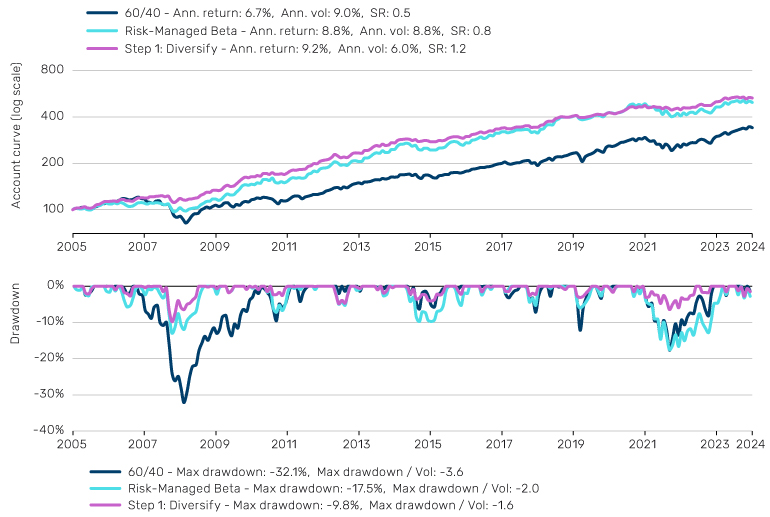
Source: Bloomberg, Man Group Database. Date range: 1 January 2006 to 31 December 2024.
In line with our expectations of the Z-shift, the addition of new strategies to the Step 1: Diversify portfolio have led to a reduction in the overall portfolio volatility to around 6%. This is, in part, driven by the mitigation in drawdowns of the Risk-Managed Beta portfolio. A key example of this was in 2022, where the impact of the inflation-driven bond and equity selloff was largely mitigated.
The Step 1: Diversify portfolio also achieves a slightly better return than Risk-Managed Beta, despite the lower risk, but we can monetise in step two of the Z-shift to scale up our returns further.
Step 2: Capital Efficiency
Applying the insights from If It Moves, Monetise It, we can capitalise on the inherent cash efficiency of the various strategies traded in our portfolio, mostly comprising futures and forwards to notionally fund each strategy.
Figure 7 illustrates the notional exposures of the Step 1: Diversify portfolio and the Step 2: Capital Efficiency portfolio, differing only by the latter’s use of leverage, as they both use the same cash exposure. The notional allocations to each strategy within the Step 2 portfolio are chosen to maximise the level of cash-efficiency, inclusive of a reasonable cash buffer.
Figure 7. Portfolio notional allocations of Step 1: Diversify and Step 2: Capital Efficiency portfolios
Problems loading this infographic? – Please click here
Source: Bloomberg, Man Group Database. Date range: 1 January 2006 to 31 December 2024.
Figure 8 below highlights how the capital efficiency increases the level of volatility in the Step 2: Capital Efficiency portfolio, but only to a level that is slightly higher than the 60/40 and Risk-Managed Beta portfolios. The improvement we have achieved on the numerator of Sharpe is much more compelling though. The Step 2: Capital Efficiency portfolio doubles the return compared to the Risk-Managed Beta portfolio and triples it relative to an unlevered 60/40 portfolio. Considering both risk and return in tandem, from our starting point of 60/40, we have increased our Sharpe by approximately 2.5x.
Figure 8. Performance and drawdowns of 60/40, Risk Managed Beta, Step 1: Diversify and Step 2: Capital Efficiency portfolios
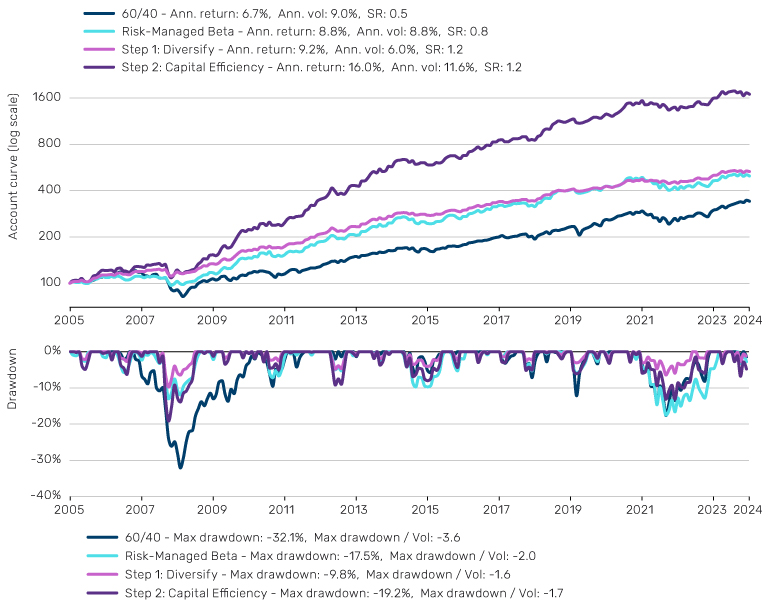
Source: Bloomberg, Man Group Database. Date range: 1 January 2006 to 31 December 2024.
The reader may notice, however, that the drawdowns have increased commensurately as a result of step two. Fear not, as this is taken care of in step three.
Step 3: Active Risk Management
Active risk management in the beta Z-shift is implemented via three risk management overlays, which directly operate to reduce portfolio exposure as market risks flare. In the context of our Step 3 portfolio, we need to apply these risk management enhancements indirectly through additional strategies that have defensive characteristics i.e. perform best when traditional assets do not. As identified by our colleagues in The Best of Strategies for the Worst of Times, trend-following and long/short quality (L/S quality) present themselves as suitable options.
It is worth noting that for trend-following in this step, we are referring to a traditional implementation, trading purely trend models on the most liquid futures and forwards markets. The primary benefit of a traditional implementation is linked to what this step aims to achieve – convexity. When macroeconomic themes are driving markets downwards, be it inflation or central bank activity or geopolitics, these macro trends are best captured in the most macro-sensitive instruments such as futures and forwards. This is also what lends to traditional trend’s historical tendency to outperform in risk-off periods for traditional assets, i.e. ‘crisis alpha’ as evidenced in Gaining Momentum. Traditional trend-following’s other properties, including its low correlation to beta at the centre of the return distribution and long-term positive track record assist nicely in risk management.
Like many strategies, however, trend-following has an Achilles heel – short, sharp price reversals. During reversals, trend-following is unable to flip positions in time to adapt to the new market direction, thereby incurring losses. As we show in Attack Wins You Games, Defence Wins You Titles, a L/S quality cash equity strategy pairs well based on its ability to cushion trend’s losses during sharp risk-off moves, capturing an effect known as the flight-to-quality. Think of reversals such as Silicon Valley Bank’s collapse in March 2023 or the Japanese yen carry unwind in August 2024, for example. Aside from its complementarity, L/S quality’s performance across a history of equity sell-offs affirms its defensive credentials on a standalone basis.
We often refer to the defensive combination of trend-following and L/S quality as being a ‘yieldy put’ (see Yieldy Put: To Infinity and Beyond Bonds for more). What earns the combination its moniker is that, unlike traditional defensive strategies, such as rolling put options, both strategies do not have a negative long-term carry. Put differently, these desirable convexity traits do not come at the expense of a long-term return strain when traditional assets are doing well. This is illustrated in Figure 9: the chart on the left highlights its put-like characteristics, (it outperforms during adverse periods), while the chart on the right showcases its yieldy attributes (delivering returns across all quintiles of beta performance).
Figure 9. Performance of 50% trend-following and 50% L/S quality during worst quarters for Risk-Managed Beta and performance in Risk-Managed Beta quintiles
Problems loading this infographic? – Please click here
Source: Bloomberg, Man Group Database. Date range: 1 January 2006 to 31 December 2024. *50% trend-following/50% L/S quality ex-post volatility scaled to match Risk-Managed Beta’s volatility.
In Figure 10, we plot all of our portfolios alongside the new Step 3: Active Risk Management portfolio. The notional allocations here, again, are set based on allocating approximately equal risk to the Risk-Managed Beta, diversifying strategies and defensive strategy sleeves, while maximising the capital efficiency in each strategy, inclusive of a reasonable cash buffer.
Figure 10. Portfolio notional allocations and performance combinations
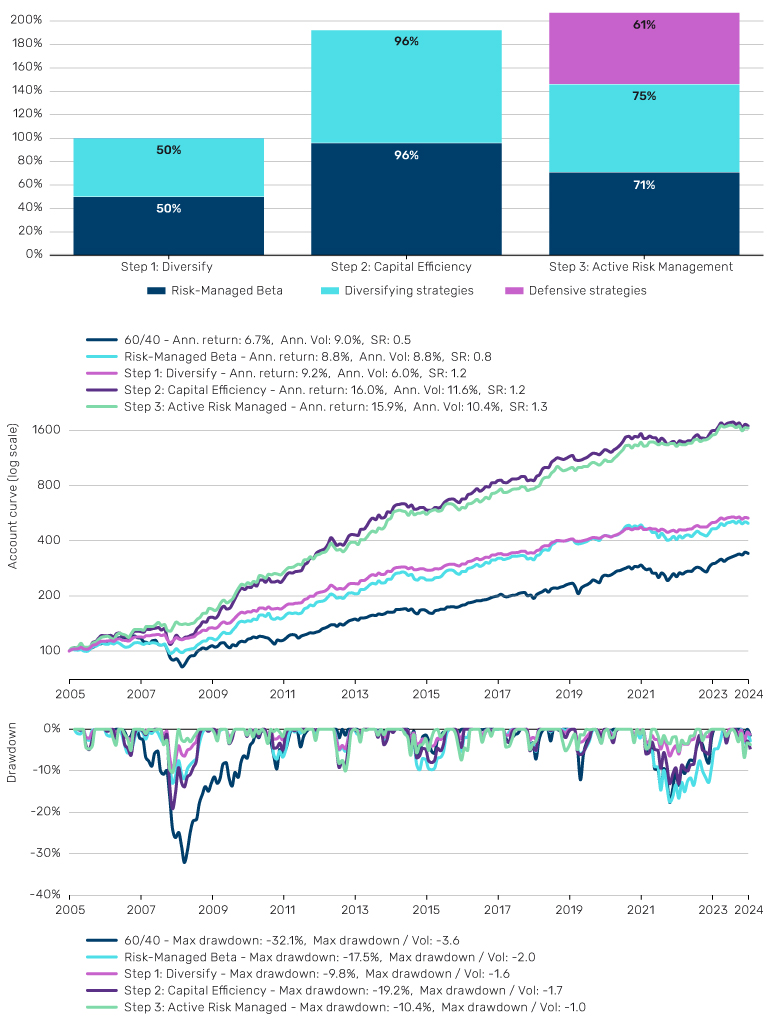
Source: Bloomberg, Man Group Database. Date range: 1 January 2006 to 31 December 2024.
The addition of the defensive strategies in the Step 3 portfolio has meaningfully reduced drawdowns from the Step 2 portfolio, with the GFC, COVID-19 and 2022’s inflation episode as prominent examples. Indeed, the maximum drawdown of the Step 3 portfolio is around 10.4%, exactly in line with the annualised volatility. The shallower drawdowns have also led to a Sharpe improvement of 0.1 points relative to the Step 2 portfolio. Comparing the Step 3 portfolio to our starting point of 60/40, we have almost tripled the return and Sharpe ratio with a third of the maximum drawdown.
Parting thoughts
We are cognisant that investors have different goals and constraints that will inevitably influence how their version of the Z-shift, in terms of strategies and allocations selected, is applied. By following the recipe, however, we have arrived at a balanced portfolio that blends together pertinent variables of return, volatility, Sharpe, drawdown, convexity and correlation that we believe reflects the real-world balance that investors need to strike.
Implementing this portfolio, or some variant of it, also has inherent structuring benefits, including the ability to net performance fees across the breadth of alpha-based content, providing a cost-saving tailwind versus implementing each strategy on a standalone basis. The capital efficiency also predicates that an additional cash top-up or a reduction in the notional exposure to beta – where we appreciate some investors will be reluctant to give up the positivity of equity beta over the last 20 years – is not necessary. In summary, this recipe gives you both a quality dish and all the trimmings.
Bibliography
Harvey, C. R., Hoyle, E., Sargaison, M., Taylor, D., van Hemert, O. (2019), “The Best of Strategies for the Worst of Times”, Man Institute, Available at: https://www.man.com/maninstitute/best-of-strategies-for-the-worst-of-times
Korgaonkar, R., Robertson, G. (2021), “We See Risk Where Others May Not: Active Risk Management in Practice”, Man Institute, Available at: https://www.man.com/maninstitute/active-risk-management-in-practice
Korgaonkar, R., Robertson, G. (2023), “Dial Up Return, Not Risk: The Z-shift Framework”, Man Institute, Available at: https://www.man.com/maninstitute/Z-shift-framework-empirical-evaluation
Korgaonkar, R., (2024), “The Big Picture: Forecast Fatigue – Diary of a Quant”, Man Institute, Available at: https://www.man.com/insights/the-big-picture-forecast-fatigue
Panjabi, Y, Robertson, G. (2023) “Trend-Following and Long/Short quality: Attack Wins You Games, Defence Wins You Titles, Man Institute, Available at: https://www.man.com/maninstitute/trend-following-long-short-quality-attack-wins
Panjabi, Y, Roberston, G. (2024) “The Yieldy Put: To Infinity and Beyond Bonds” ”, Man Institute, Available at: https://www.man.com/maninstitute/yieldy-put-infinity-and-beyond-bonds
Roberston, G. (2023), “What’s Trending: Trend-following – What’s Not to Like?”, Man Institute, Available at: https://www.man.com/maninstitute/trend-following-what-not-to-like
Robertson, G. (2023), “Trend-Following: If it Moves, Monetise it!”, Man Institute, Available at: https://www.man.com/maninstitute/trend-following-if-it-moves-monetise
Robertson, G. (2022), “Gaining Momentum: Where Next for Trend-Following?”, Man Institute, Available at: https://www.man.com/maninstitute/gaining-momentum-trend
This information herein is being provided by GAMA Investimentos (“Distributor”), as the distributor of the website. The content of this document contains proprietary information about Man Investments AG (“Man”) . Neither part of this document nor the proprietary information of Man here may be (i) copied, photocopied or duplicated in any way by any means or (ii) distributed without Man’s prior written consent. Important disclosures are included throughout this documenand should be used for analysis. This document is not intended to be comprehensive or to contain all the information that the recipient may wish when analyzing Man and / or their respective managed or future managed products This material cannot be used as the basis for any investment decision. The recipient must rely exclusively on the constitutive documents of the any product and its own independent analysis. Although Gama and their affiliates believe that all information contained herein is accurate, neither makes any representations or guarantees as to the conclusion or needs of this information.
This information may contain forecasts statements that involve risks and uncertainties; actual results may differ materially from any expectations, projections or forecasts made or inferred in such forecasts statements. Therefore, recipients are cautioned not to place undue reliance on these forecasts statements. Projections and / or future values of unrealized investments will depend, among other factors, on future operating results, the value of assets and market conditions at the time of disposal, legal and contractual restrictions on transfer that may limit liquidity, any transaction costs and timing and form of sale, which may differ from the assumptions and circumstances on which current perspectives are based, and many of which are difficult to predict. Past performance is not indicative of future results. (if not okay to remove, please just remove reference to Man Fund).


