Featured Authors
 Armen Panossian
Head of Performing Credit and Portfolio Manager
 Danielle Poli, CAIA
Managing Director, Multi-Asset Credit Product Specialist and Head of the Product Specialist Group
THE NEW “T” WORD
“Transition: (a) A change or shift from one state, subject, place, etc. to another;
(b) Something that links one state, subject, place, etc. to another; a connecting part or piece.”
– Merriam-Webster.com
The financial word of the year in 2021 was clearly “transitory” – the adjective Federal Reserve Chair Jay Powell probably wishes he’d never used to describe rising inflation. But in 2022, investors are likely to be focused on a different – and potentially scarier – “T” word: transition. Loose U.S. fiscal and monetary policy helped fuel abnormal economic trends, such as the massive spike in personal income, that boosted GDP growth in 2021. But these trends are normalizing just as rapidly rising inflation is forcing the Fed to accelerate its timeline for tightening monetary policy. The economy is therefore transitioning into a new phase, in which businesses, consumers and investors will have far less government support. Prices in many asset classes have weakened in recent weeks, and it’s unclear whether markets can regain their momentum when the government no longer has its foot on the gas.
THE PUSH
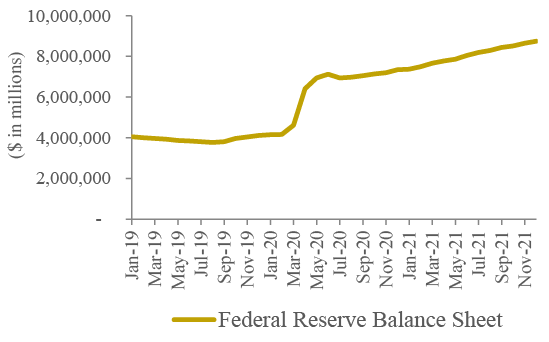
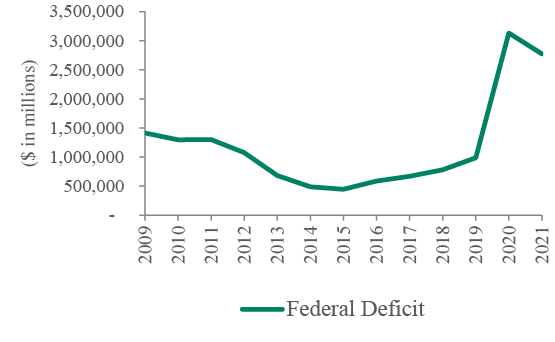
The U.S. government’s impact on the economy and financial markets may be best reflected in two numbers. The first is $8.9 trillion, the size of the Fed’s balance sheet, which has more than doubled after almost two years of massive bond purchases that flooded markets with liquidity (see Figure 1). The second is $2.8 trillion, the size of the U.S. federal deficit, which almost tripled in size between 2019 and 2021, after several rounds of multi-trillion-dollar stimulus packages (see Figure 2). And that’s just in the U.S.: over $30 trillion in monetary and fiscal support has been pushed into the global economy over the last two years.1
Figure 1: The Federal Reserve’s Balance Sheet Has Ballooned
Source: Federal Reserve Bank of St. Louis
Figure 2: The U.S. Federal Deficit Has Skyrocketed
Source: Federal Reserve Bank of St. Louis
While much of this activity was warranted, given the magnitude of the Covid-19 crisis, this tremendous money creation and spending splurge also had unintended consequences – especially in the U.S. These trends have likely contributed to rising inflation, boosted asset prices, and created distortions in the economy that – while supportive of growth in the short term – might have made investors overly optimistic about the economic recovery.
For example, annual U.S. real personal income eclipsed $19 trillion in January 2021 and $21 trillion in March 2021, following the release of respective $900 billion and $1.9 trillion stimulus packages (see Figure 3). This income boost is likely a major reason why the U.S. economy expanded by an annualized rate of 6.3% in the first quarter of 2021 and 6.7% in the second. Unsurprisingly, after stripping out government support, incomes mostly rose in line with projections based on long-term averages over the last two years (see Figure 3).2
The U.S. personal savings rate also spiked to abnormally high levels during the pandemic – hitting 33.8% in April 2020 and 26.6% after stimulus payments were distributed in 2021.3 The increase in savings wasn’t solely a U.S. phenomenon. Global households are estimated to have amassed over $5 trillion in excess savings during 2020 and early 2021.4 Extra cash in consumers’ bank accounts provided spending power that helped the global economy grow by an estimated 5.7% last year – the highest rate in decades.5
Figure 3: U.S. Federal Spending Fuels Rise in Personal Income

Source: Federal Reserve Bank of St. Louis
Note: Seasonally Adjusted Annual Rate
THE PULL
But that was 2021. While a recession appears unlikely in 2022, the same cannot be said of an economic slowdown. Another boost of fiscal support is unlikely in the near term, as the Biden administration’s Build Back Better legislation appears unlikely to pass in its current form.
As fiscal support for the economy has declined, so have the trends that supported rapid growth. Real personal income and the savings rate have fallen below $18 trillion and 7.0%, respectively, limiting fire power for future spending.6 Meanwhile, consumption of goods, though well above its long-term average (see Figure 4), has slowed and will likely continue normalizing in 2022, particularly spending on durable goods. Households that bought new refrigerators, washing machines or other long-lasting products in the last two years shouldn’t be expected to buy them again this year. Increased spending on services may not offset a significant decrease in goods consumption.
Figure 4: Consumption of Goods Has Been Abnormally High

Source: Federal Reserve Bank of St. Louis
Note: Seasonally Adjusted Annual Rate
While many 2021 trends are normalizing, one just keeps accelerating: inflation. Prices were only rising by 1.4% in the 12 months through January 2021, but this sped up to 7.0% by December.7 Wage increases normally play a major role in sustaining a high inflation rate, as we noted in our Performing Credit Quarterly 3Q2021. Not only did wages rise by 4.7% over the 12 months through December, but these gains were also fairly widespread across sectors and income groups. Additionally, the unemployment rate fell to 3.9% in December, nearing the 50-year-low of 3.5% recorded in February 2020.8 A tighter labor market could push wages – and prices – upward.
In response, the Federal Reserve has signaled that it will begin pulling back its monetary support for the economy. The central bank has (a) accelerated its schedule for tapering bond purchases; (b) indicated that it may increase interest rates multiple times in 2022; and (c) suggested that it may begin trimming its balance sheet (i.e., quantitative tightening) in the near term.
Other monetary policymakers have completed their own “hawkish pivots.” Many emerging markets central banks hiked interest rates last year to combat rampant inflation, and they were joined by some of their developed market counterparts, including the Bank of England and the Bank of New Zealand.
Damage to businesses caused by the pandemic may have been masked by accommodative government policy over the last two years, but these scars could become visible as economies transition into a new environment. Investors should consider how valuations based on extrapolations from last year’s economic “sugar high” will hold up when most major world economies are no longer receiving a fiscal and monetary boost.
THE FOCUS
We think credit investors should keep a few key points in mind as they navigate this unpredictable sea change:
(1) Default rates may remain low even if the global economy stumbles, but leverage remains a risk.
The default environment was exceptionally benign in 2021 across developed markets. Default rates for high yield bonds and loans were well below 1.0% in the U.S. and Europe, and these rates are unlikely to rise significantly even if economic growth slows in 2022. That’s because the capital markets have been very generous over the last two years. In 2021, activity in U.S. high yield bond and loan primary markets reached record highs – with gross issuance of approximately $483 billion and $835 billion, respectively.9 Many companies took advantage of this opportunity to refinance their debt at longer maturities and lower interest rates. With few major debt maturities in 2022, there is less opportunity for companies to default.
However, low default risk doesn’t mean credit investors should be complacent. Security prices for highly indebted companies could still suffer in 2022 – and not only because of rising interest rates. A company’s capital structure may look manageable when the economy is growing at a fast rate and earnings are strong, but this same company’s leverage (i.e., its ratio of debt to earnings) may look far less manageable if a slowing economy causes the company’s fundamentals to decline meaningfully. Spiking leverage could spook investors and lead to credit ratings downgrades, which could weigh on these issuers’ security prices.
(2) Investors may continue to favor short-duration assets.
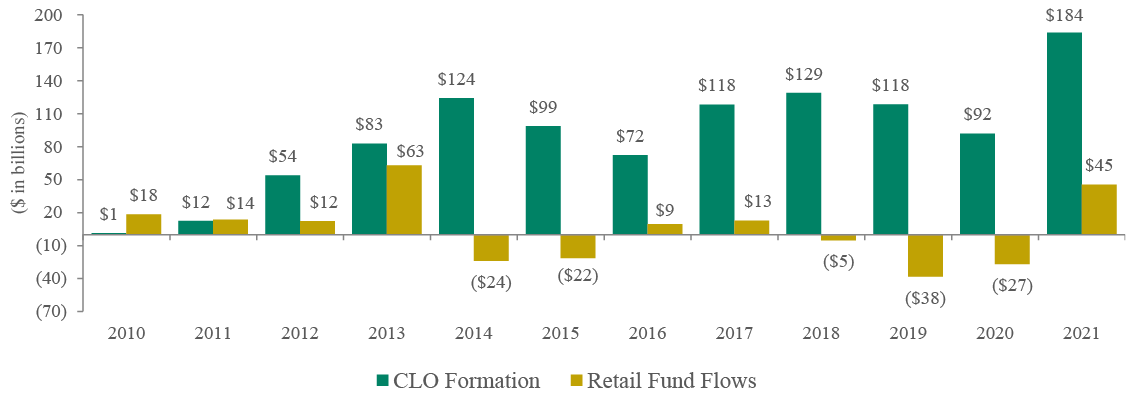
In 2021, many credit investors sought to reduce their portfolios’ duration (i.e., sensitivity to interest rate increases) by favoring floating-rate assets over their fixed-rate counterparts. Loans, which mostly have floating rates, recorded annual U.S. retail fund inflows of roughly $45 billion in 2021 – the first annual inflow in four years and the asset class’s second-largest ever.10
While high yield bonds, which have fixed rates, recorded retail fund outflows in 2021, they outperformed investment grade bonds, partly because the former have an average duration under four years, less than half that of the latter.11 Likewise, the segment of high yield bonds with the longest duration, BB-rated bonds, lagged behind the rest of the asset class.12 If interest rates continue to rise, floating-rate assets – including loans, collateralized loan obligations (CLOs) and real-estate-backed structured credit – may perform well.
(3) Debt investors should be wary of inflated results, especially in private markets.
Credit investors should always maintain a skeptical eye when underwriting, whether they’re active in the liquid or tradeable debt markets. This is especially true in today’s crowded private credit market, where leverage levels are high, earnings may be unsustainable, and companies have increasingly been able to borrow with few covenants. Many companies recorded spectacular financial results in 2021 as economies began to reopen, but investors should be wary of valuing assets and making investment decisions based on results that are unlikely to be repeated. Undisciplined investors eager to deploy capital may not be compensated for the risk they’re taking – and could see their returns suffer.
(4) China’s uncertain outlook presents risk and opportunities.
China’s GDP grew by only 4.0% in the fourth quarter – the lowest rate in 18 months – fueling investor concerns about the strength of one of the world’s largest economies. The People’s Bank of China, unlike many major central banks, is trying to spur economic activity by loosening monetary policy, but the government’s desire to reduce leverage in the economy – particularly in the property sector – may limit how much accommodation policymakers can provide. China is a major consumer of most raw materials, so a slowdown in its economy could cause commodity prices to fall, threatening the fragile recoveries of many commodity-exporting emerging markets countries. This situation represents serious risk, but it could also create opportunities for patient EM investors who aren’t trying to “call the bottom” in a weak market but are instead focused on identifying companies with strong fundamentals that can likely withstand a downturn.
YOU CAN’T PREDICT. YOU CAN PREPARE
At this pivotal moment, even bottoms-up investors have to consider the implications of macroeconomic forces, but we believe this should be done with humility. As we always say at Oaktree, we can’t predict the future. No one knows whether the economy’s transition will be smooth or, if it’s not, whether a weakening economy will cause inflation to decrease, reducing the pressure on the Fed to increase interest rates. No one knows if the Fed is overreacting to inflation that, in the absence of fiscal accommodation, would ultimately have proven to be transitory. Or if the central bank is acting too late and will thus have to tighten policy aggressively, increasing the likelihood of a significant economic downturn. We believe that the less clarity investors have about the macro climate, the more focused they should be on deep, exhaustive credit analysis. Unlike pandemic-era predictions, this advice should age well.
ASSESSING RELATIVE VALUE
PERFORMANCE OF SELECT INDICES

As of December 31, 2021
Sources: Bloomberg Barclays, Credit Suisse, FTSE, ICE BofA, JP Morgan, S&P Global, Thomson Reuters13
DEFAULT RATES BY ASSET CLASS

Sources: Bank of America, Credit Suisse, JP Morgan14
STRATEGY FOCUS
HIGH YIELD BONDS
Market Conditions: 4Q2021
U.S. HIGH YIELD BONDS
Return: 0.7%15
Issuance: $73.3bn16
LTM Default Rate: 0.3% 17
-
High yield bonds proved resilient: The asset class produced a positive return despite investor fears about rising inflation and the Omicron variant. The U.S. market outperformed the global high yield benchmark.18
-
Defaults were minimal: The 2021 default rate came in below analysts’ expectations, partly because of above-average corporate cash balances and generous capital markets.19
-
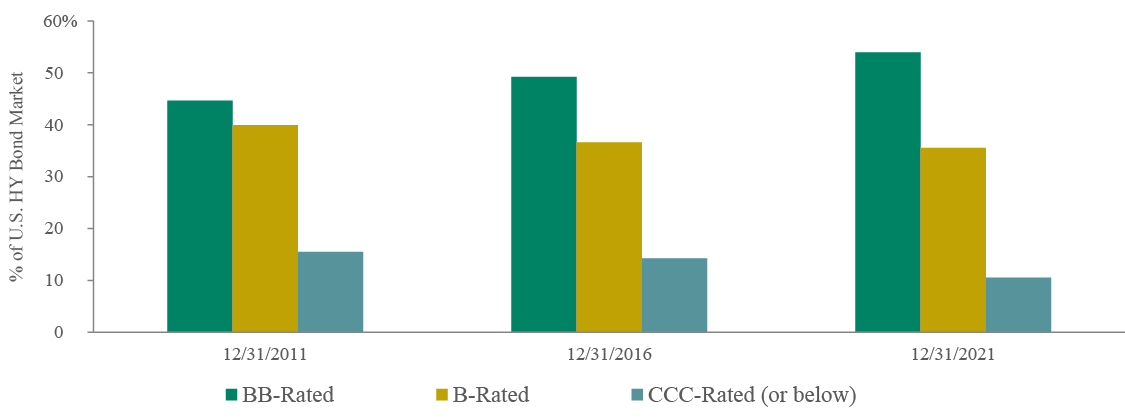
Issuance reached record heights: The primary market was very active in 4Q2021. The ratings mix of this issuance improved the average credit quality of the asset class (see Figure 5).
EUROPEAN HIGH YIELD BONDS
Return: -0.5%20
Issuance: €27.6bn21
LTM Default Rate: 0.2%22
-
The riskiest bond category outperformed: CCC-rated bonds returned 0.7% in 4Q2021, the only ratings segment to produce a positive quarterly return.23
-
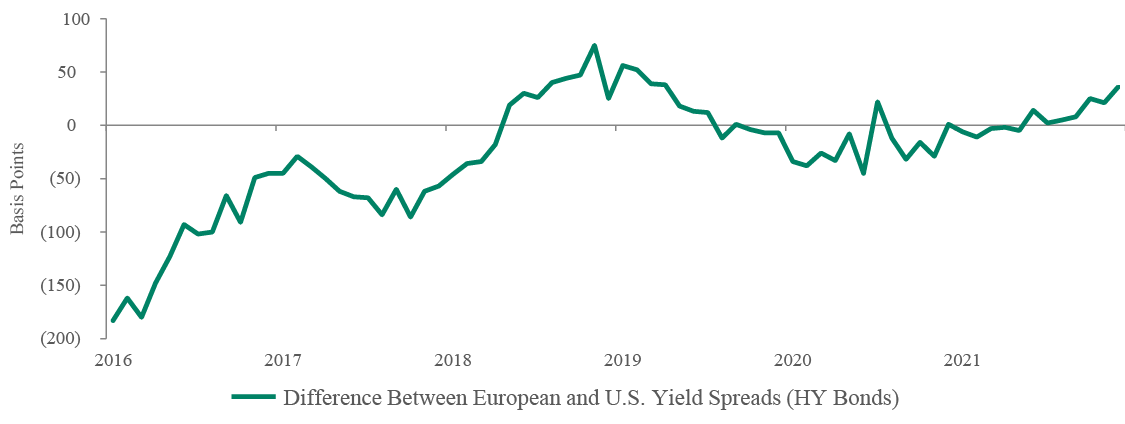
Yield spreads are attractive on a relative basis: The yield pickup versus the U.S. high yield market increased throughout 2021 (see Figure 6).24
-
Risk was isolated to individual credits: The asset class’s default rate was extremely low, but managers differentiated themselves by their ability to avoid troubled credits.
Outlook
Opportunities
-
Investors appear to be adequately compensated for default risk: Analysts are anticipating low default rates in 2022 for the U.S. and Europen markets, as issuers’ fundamentals are improving and near-term maturities are minimal following the 2020–21 wave of refinancings.25
-
Covenant-lite loans are providing highly leveraged U.S. companies with flexibility: High yield bond issuers increasingly have access to loans with few restrictions or requirements (i.e., cov-lite loans). While such borrowing may increase risk in the long term, access to this relatively unrestricted source of capital makes bond/loan issuers less likely to default on their bonds in the near term.
Risks
-
Tightening Federal Reserve policy could harm heavily indebted companies: Low-rated corporate issuers might struggle to roll over debt if elevated inflation forces the Fed to increase interest rates aggressively. The European Central Bank is likely to remain relatively dovish, but the Bank of England has already begun increasing interest rates.
-
Defaults could increase if energy prices drop: The energy sector performed well in 2021, but slowing consumer demand (especially reduced activity in China) could decrease energy usage.
-
Rising inflation could erode companies’ fundamentals: Today’s low default rates could increase if companies facing rising input costs can’t pass along price increases to customers. Low yield spreads mean that many companies are priced for perfection, and even a minimal deterioration in fundamentals could markedly weaken the high yield bond market.
Figure 5: Credit Quality Is Improving in the U.S. High Yield Bond Market
Source: JP Morgan
Figure 6: European High Yield Bonds Offer Wider Yield Spreads Than Their U.S. Counterparts
Source: JP Morgan
SENIOR LOANS
Market Conditions: 4Q2021
U.S. SENIOR LOANS
Return: 0.7%26
Issuance: $179.6bn27
LTM Default Rate: 0.5%28
-
Robust CLO formation boosted loan performance: $55.4bn in new CLOs priced in 4Q2021, bringing the 2021 total to $183.7bn (see Figure 7).29
-
Retail demand remained very strong: Mutual funds and ETFs recorded their 13th consecutive month of inflows in December. Their combined quarterly inflows hit $9.7bn, bringing the full-year total to $45.0bn (see Figure 7).30
-
Loans performed well in 2021: Loans’ annual return was similar to that of high yield bonds but less volatile.
EUROPEAN SENIOR LOANS
Return: 0.7%31
Issuance: €22.5bn32
LTM Default Rate: 0.2%33
-
Primary activity was very robust: Issuance reach a record-high €129.7bn in 2021.34
-
Yield spreads are relatively wide: They remained above 400 bps at year-end – very attractive in today’s credit market.35
-
Performance of the riskiest loan segment has waned: CCC-rated loans underperformed the asset class in the past two quarters, returning only 0.1% in 4Q2021 (see Figure 8).36 This reversed the trend seen in the previous four quarters. Slowing economic growth and the spread of the Omicron variant dented investors’ risk appetite. B-rated loans outperformed the asset class in 4Q2021, returning 0.8%.37
Outlook
Opportunities
-
Loans offer attractive relative value: Both U.S. and European loans offered wider yield spreads than their regions’ respective high yield bond markets at year-end.38
-
Rising interest rates should support relative performance: Credit investors will likely seek to shorten duration as central banks tighten monetary policy, making floating-rate loans in both regions more attractive.
-
CLO formation will likely remain a tailwind: While CLO issuance may slow in 2022, it should still be robust enough to support loan prices.
-
The default environment remains benign: The U.S. trailing-12-month default rate is the lowest since 2011.39 Improving borrower fundamentals in both regions should further reduce the likelihood of default.
Risks
-
Elevated loan prices may limit return potential: Around 55% of U.S. senior loans were trading above 99.5 cents on the dollar at year-end.40
-
The supply/demand dynamic could degrade loan quality: Loan covenants have weakened because of strong investor demand for floating-rate debt and the benign default environment. Issuer-friendly loans may encourage imprudent borrowing, which could prove problematic in the long term.
-
Elevated inflation could harm companies’ fundamentals: Borrowers may struggle to pass along cost inflation to customers, which could negatively impact their earnings.
-
Tightening central bank policy could impede economic growth: Rising interest rates could slow economic activity. The European Central Bank will likely remain more dovish than the Federal Reserve, but the actions of the latter may also put pressure on the former to make monetary policy less accommodative.
Figure 7: U.S. CLO Formation and Retail Inflows Were at or Near 10-Year Highs in 2021
Source: JP Morgan
Figure 8: Risky European Loans Are No Longer Outperforming

Source: Credit Suisse Western Europe Leveraged Loan Index (EUR hedged)
EMERGING MARKETS DEBT
Market Conditions: 4Q2021
EM Corporate Bond Return: -0.6%41
EM Corporate High Yield Bond Return: -1.2%42
-
Defaults in China spiked: China’s high yield bond market and its property sector recorded default rates of 19.4% and 29.7%, respectively, in 2021.43
-
Defaults in EM (ex. China) were limited: The EM corporate high yield bond default rate was 7.1% in 2021 – the highest since 2009; however, when excluding China, the rate drops to 1.2%, lower than in 2020.44
-
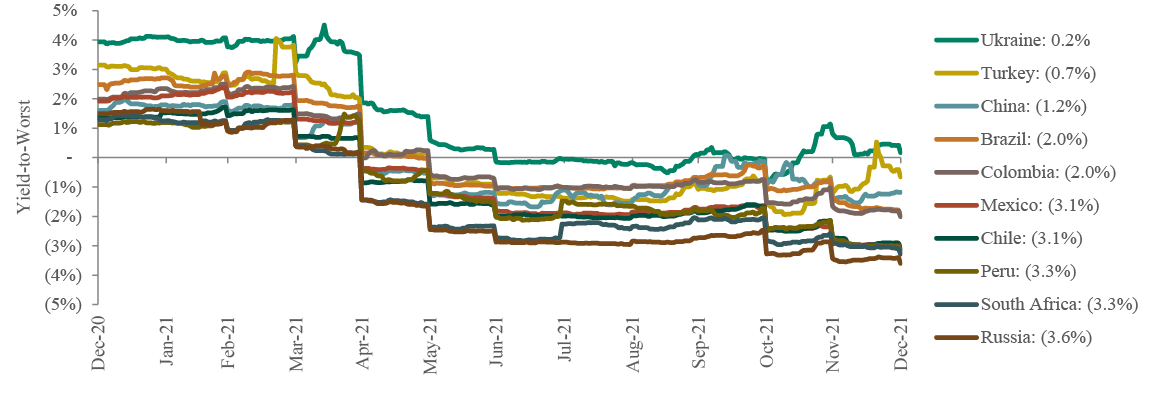
Corporate bond real yields remain negative in most EM countries: Rising inflation has eroded value, underscoring the disadvantages of an index-based approach to EM debt investment (see Figure 9).
Outlook
Opportunities
-
Weakness emanating from China may continue to create buying opportunities: Investor concerns about Chinese growth and the country’s property sector could intensify, causing EM debt to weaken more than it has in recent months. The debt of EM companies with strong fundamentals may trade at attractive prices in this scenario.
-
Issuers that can generate consistent cash flow should be well situated even if market conditions deteriorate: Such companies should be able to meet their debt service obligations even if central banks tighten monetary policy and the global economic recovery slows.
Risks
-
Slowing growth in China may negatively impact EM economies, especially commodity-exporting countries: China’s GDP only grew by 4.0% in 4Q2021, though its economy expanded by 8.1% in 2021.45 The government’s severe response to Covid-19 outbreaks – the “zero Covid” strategy – could hinder growth. China is the world’s largest consumer of most commodities, so prices of these raw materials could decline if the country’s growth continues to slow.
-
EM economies could suffer as developed market central banks tighten monetary policy: EM countries and companies could struggle to roll over and service debt in a rising-interest-rate environment.
-
Intensifying political risk could weigh on EM credit prices: Tensions between Russia and Ukraine, rising populism in Latin America, and instability in Turkey could erode investor confidence in EM credit.
Figure 9: Most Emerging Markets Corporate Bond Real Yields Are Negative
Source: Bloomberg
GLOBAL CONVERTIBLES
Market Conditions: 4Q2021
Return: -1.9%46
Issuance: $23.7bn47
LTM Default Rate: 0.9%48
-
The asset class’s performance lagged that of global equities in 4Q2021: The convertibles market is underweight many of the sectors that outperformed in the fourth quarter. It has significant exposure to high-multiple, high-growth issuers that have performed poorly in response to the Federal Reserve’s hawkish pivot.
-
Chinese equities were one of the worst-performing markets: The Hang Seng Index fell by 14.0% in 2021. Markets were rattled by Chinese regulatory announcements; defaults in the property sector, including at China Evergrande Group; and severe Covid-19 policies. Convertibles’ exposure to weak Asian corporates negatively impacted the asset class’s performance.
Outlook
Opportunities
-
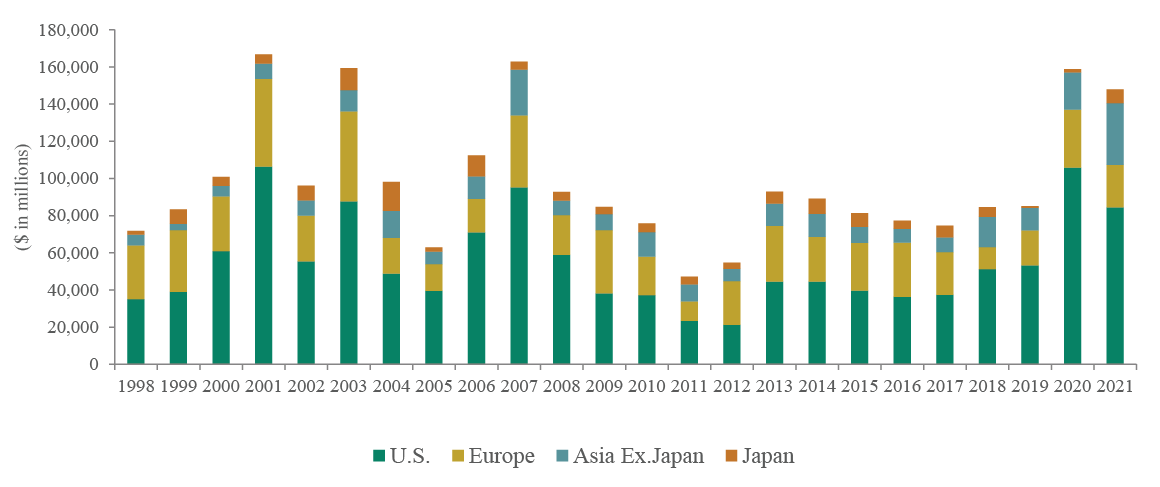
Robust issuance across sectors has expanded the investment universe and increased diversity: Investors who are seeking to locate value under challenging market conditions have an expansive opportunity set (see Figure 10).
-
Market weakness could create buying opportunities: Global equity prices declined in early January. Value-oriented convertibles investors may be able to identify bargains in this environment.
Risks
-
Investors remain concerned about China’s slowing growth, unpredictable policy decisions, and heavily indebted property sector: While China’s economy expanded by 8.1% in 2021, it only grew by 4.0% in 4Q2021.49 Investors may worry that shifting government priorities could continue to weigh on the country’s economy. Fear of contagion could cause sell-offs in emerging market equities.
-
High-multiple companies could underperform: Convertibles are highly exposed to growth-oriented stocks, which may continue to decline in value if interest rates keep rising.
Figure 10: Issuance Has Neared Record Levels for Two Consecutive Years
Source: Bank of America
STRUCTURED CREDIT
Market Conditions: 4Q2021
U.S. CLO Issuance: $55.4bn50
European CLO Issuance: €12.9bn51
-
Corporate
-
CLO issuance hit record heights in 2021: For the full year, both the U.S. and European primary markets set new issuance records, pricing $183.7bn and €38.6bn, respectively.52 This was likely, in part, because managers wanted to price CLOs before year-end, when the mandatory transition from LIBOR to SOFR53 became effective.
-
CLO issuance slowed in December: Approximately $10.0bn in U.S. CLOs were priced in December, well below the 2021 monthly average.54 However, this slowdown was anticipated.
-
-
Real Estate
-
The primary market remained very active through year-end: Issuance of Single-Asset Single-Borrower commercial mortgage-backed securities totaled roughly $78.0bn in 2021, an all-time high.55 In 2021, issuance of SASB CMBS, commercial real estate (CRE) CLOs, and residential mortgage-backed securities reached post-2008 highs.56
-
Yield spread widening has been uneven: The yield spreads of low-rated real estate debt tranches widened more than those of higher-rated tranches.
-
Outlook
Opportunities
-
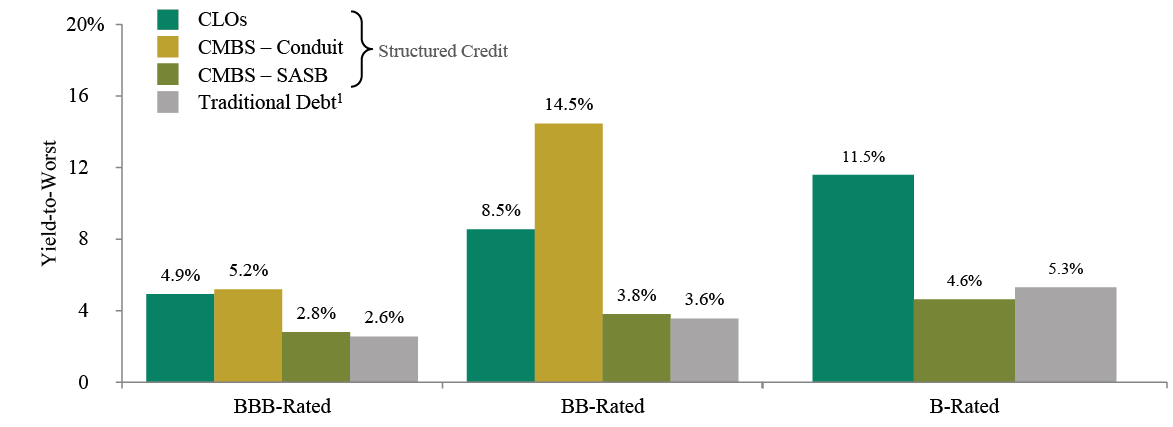
BB-rated CLO debt tranches have many sources of potential value: These instruments have attractive structural and credit enhancements as well as low sensitivity to interest rates increases (see Figure 11).
-
Floating-rate securities should be well positioned in a rising-interest-rate environment: Both corporate and real estate structured credit may benefit from investors’ desire to shorten duration.
Risks
-
Uncertainty about the future of offices may weigh on CRE prices: The Omicron variant delayed many companies’ return-to-office plans. Such delays may increase the likelihood that hybrid working and full-time remote work continue after the pandemic ends.
-
CLOs have historically performed poorly during bouts of equity market weakness: However, the securities’ short duration and the underlying loans’ low default risk could potentially support CLO prices, even if economic growth slows.
Figure 11: Structured Credit Offers Higher Yields Than Most Traditional Debt
As of December 31, 2021
Sources: Bloomberg Barclays Index Services, FTSE Global Markets, Credit Suisse, JP Morgan
Note: The traditional debt alternative represents a similarly rated asset class for each rating category: the Bloomberg Barclays Investment Grade Corporate Bond Index (BBB ratings), the FTSE High Yield Cash-Pay Capped Index (BB rating) and the Credit Suisse Leveraged Loan Index (B rating).
PRIVATE CREDIT
Market Conditions: 4Q2021
-
The definition of “middle market” has expanded: It’s increasingly common for U.S. businesses to borrow over $1bn from middle-market direct lenders.
-
Borrowers may have the upper-hand: Mounting competition to finance high-quality U.S. businesses has caused coupons to fall, leverage multiples to rise, and terms to become more borrower-friendly in much of the direct lending market.
-
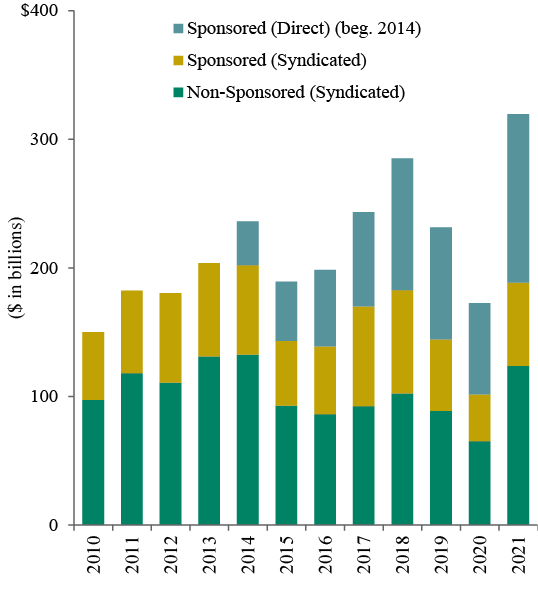
Middle-market loan volume has soared: U.S. middle-market loans representing approximately $116.0 bn were issued in 4Q2021.57 The 2021 total of $319.0 bn represented a new record (see Figure 12).
Outlook
Opportunities
-
Deal flow in 2022 is expected to exceed the 2021 level: This is due to investors’ abundant liquidity and ongoing improvements in businesses’ performance from the pandemic-related trough in 2020.
-
Fast-growing life sciences and software companies may access capital through direct lending markets: We expect significant lending opportunities will develop in these industries, driven by technological advancements and sizable research & development requirements.
-
Rising interest rates and slowing economic growth may make European banks less willing to lend: European borrowers outside the sponsor-backed market have traditionally had to rely on banks or informal sources of capital, but these borrowers may now turn to direct lenders as bank lending decreases.
Risks
-
Businesses’ fundamentals could weaken in 2022: Shortages of labor and key inputs could impede growth and weigh on companies’ earnings – especially businesses that can’t pass rising costs onto customers. Additionally, as government spending normalizes, businesses’ problems that were masked by high levels of fiscal support could come to the surface.
-
Competition is intensifying: Almost $34.0bn of U.S. private debt capital was raised in the first three quarters of 2021 – far eclipsing the level recorded in 9M2020.58
-
Tightening monetary policy could cause debt-servicing costs to increase: Many developed market central banks are hiking interest rates or discussing potential increases. The Federal Reserve and the Bank of England are expected to raise interest rates three and four times, respectively, in 2022.59 While the European Central Bank continues to indicate that it will remain dovish, it may be forced to tighten policy due to inflationary pressures and the actions of other central banks.
Figure 12: Middle-Market Loan Volume Reached Record High
Source: Refinitiv
ABOUT OAKTREE’S PERFORMING CREDIT PLATFORM
Oaktree Capital Management is a leading global alternative investment management firm with expertise in credit strategies. Our Performing Credit platform encompasses a broad array of credit strategy groups that invest in public and private corporate credit instruments across the liquidity spectrum. The Performing Credit platform, headed by Armen Panossian, has $50.6 billion in AUM and approximately 190 investment professionals. 60
ENDNOTES
1 MUFG.
2 Chained 2012 Dollars, Seasonally Adjusted Annual Rate.
3 Federal Reserve Bank of St. Louis.
4 Moody’s Analytics.
5 Fitch Ratings.
6 U.S. Bureau of Economic Analysis.
7 U.S. Bureau of Labor Statistics.
8 U.S. Bureau of Labor Statistics.
9 JP Morgan.
10 JP Morgan.
11 Based on the durations of the FTSE High Yield Cash-Pay Capped Index and the ICE BofA U.S. Corporate Index, as of December 31, 2021.
12 JP Morgan.
13 The indices used in the graph are: Bloomberg Barclays Government/Credit Index, Credit Suisse Leveraged Loan Index, Credit Suisse Western European Leveraged Loan Index (EUR hedged), FTSE High-Yield Cash-Pay Capped Index, ICE BofA Global Non-Financial HY European Issuers ex-Russia Index (EUR hedged), Refinitiv Global Focus Convertible Index (USD hedged), JP Morgan CEMBI Broad Diversified Index (Local), JP Morgan Corporate Broad CEMBI Diversified High Yield Index (Local), S&P 500 Total Return Index, and FTSE All-World Total Return Index (Local).
14 Trailing-12-Month Default Rate.
15 FTSE High Yield Cash-Pay Capped Index.
16 JP Morgan.
17 JP Morgan.
18 FTSE High Yield Cash-Pay Capped Index; ICE BofA Non-Financial Developed Markets High Yield Constrained (USD hedged).
19 JP Morgan.
20 ICE BofA Global Non-Financial High Yield European Issuer, Excluding Russia Index (EUR hedged).
21 S&P Global Leveraged Commentary & Data.
22 Credit Suisse.
23 ICE BofA Global Non-Financial High Yield European Issuer, Excluding Russia Index.
24 FTSE High Yield Cash-Pay Capped Index; ICE BofA Global Non-Financial High Yield European Issuer, Excluding Russia Index (EUR hedged).
25 JP Morgan.
26 Credit Suisse Leveraged Loan Index.
27 JP Morgan; gross issuance includes refinancings and resets; $153.7bn net of repricings.
28 JP Morgan; Excludes distressed exchanges.
29 JP Morgan; Excludes refinancings and resets.
30 JP Morgan.
31 Credit Suisse Western Europe Leveraged Loan Index (EUR hedged).
32 S&P Global Leveraged Commentary & Data; gross issuance.
33 Credit Suisse.
34 S&P Global Leveraged Commentary & Data; gross issuance.
35 Credit Suisse Western Europe Leveraged Loan Index (EUR hedged).
36 Credit Suisse Western Europe Leveraged Loan Index (EUR hedged).
37 Credit Suisse Western Europe Leveraged Loan Index (EUR hedged).
38 Credit Suisse Leveraged Loan Index; FTSE High Yield Cash-Pay Capped Index; Credit Suisse Western Europe Leveraged Loan Index (EUR hedged); ICE BofA Global Non-Financial High Yield European Issuer, Excluding Russia Index.
39 JP Morgan.
40 Credit Suisse Leveraged Loan Index.
41 JP Morgan CEMBI Broad Diversified Index.
42 JP Morgan Corporate Broad CEMBI Diversified High Yield Index.
43 JP Morgan.
44 JP Morgan.
45 National Bureau of Statistics of China.
46 Refinitiv Global Focus Convertible Index.
47 Bank of America; gross issuance.
48 Bank of America.
49 National Bureau of Statistics of China.
50 JP Morgan; new issue only, so doesn’t include refinancings and resets.
51 JP Morgan; new issue only, so doesn’t include refinancings and resets.
52 JP Morgan.
53 Secured Overnight Financing Rate.
54 JP Morgan.
55 Barclays.
56 JP Morgan.
57 Refinitiv.
58 Preqin.
59 Bloomberg.
60 The AUM figure is as of September 30, 2021 and excludes Oaktree’s proportionate amount of DoubleLine Capital AUM resulting from its 20% minority interest therein. The total number of professionals includes the portfolio managers and research analysts across Oaktree’s performing credit strategies.
NOTES AND DISCLAIMERS
This document and the information contained herein are for educational and informational purposes only and do not constitute, and should not be construed as, an offer to sell, or a solicitation of an offer to buy, any securities or related financial instruments. Responses to any inquiry that may involve the rendering of personalized investment advice or effecting or attempting to effect transactions in securities will not be made absent compliance with applicable laws or regulations (including broker dealer, investment adviser or applicable agent or representative registration requirements), or applicable exemptions or exclusions therefrom.
This document, including the information contained herein may not be copied, reproduced, republished, posted, transmitted, distributed, disseminated or disclosed, in whole or in part, to any other person in any way without the prior written consent of Oaktree Capital Management, L.P. (together with its affiliates, “Oaktree”). By accepting this document, you agree that you will comply with these restrictions and acknowledge that your compliance is a material inducement to Oaktree providing this document to you.
This document contains information and views as of the date indicated and such information and views are subject to change without notice. Oaktree has no duty or obligation to update the information contained herein. Further, Oaktree makes no representation, and it should not be assumed, that past investment performance is an indication of future results. Moreover, wherever there is the potential for profit there is also the possibility of loss.
Certain information contained herein concerning economic trends and performance is based on or derived from information provided by independent third-party sources. Oaktree believes that such information is accurate and that the sources from which it has been obtained are reliable; however, it cannot guarantee the accuracy of such information and has not independently verified the accuracy or completeness of such information or the assumptions on which such information is based. Moreover, independent third-party sources cited in these materials are not making any representations or warranties regarding any information attributed to them and shall have no liability in connection with the use of such information in these materials.
© 2022 Oaktree Capital Management, L.P.
Informações sensíveis e divulgação
Este memorando expressa as opiniões do autor na data indicada e tais opiniões estão sujeitas a alterações sem aviso prévio. A Oaktree não tem a obrigação de atualizar as informações aqui contidas. Além disso, a Oaktree não faz nenhuma representação, e não se deve assumir que odesempenho dos investimentos passados é uma indicação de resultados futuros. Além disso, onde quer que haja potencial de lucro, também existe a possibilidade de prejuízo. Este memorando está sendo disponibilizado apenas para fins educacionais e não deve ser usado para qualquer outro propósito. As informações contidas neste documento não constituem e não devem ser interpretadas como uma oferta de serviços de consultoria ou uma oferta de venda ou solicitação de compra de quaisquer títulos ou instrumentos financeiros relacionados, em qualquer jurisdição. Certas informações contidas neste documento sobre tendências econômicas e desempenho são baseadas ou derivadas de informações fornecidas por fontes terceirizadas independentes. A Oaktree Capital Management, L.P. (“Oaktree”) acredita que as fontes das quais tais informações foram obtidas são confiáveis; no entanto, não pode garantir a exatidão de tais informações e não verificou de forma independente a exatidão ou integridade de tais informações ou as suposições nas quais tais informações se baseiam. Este memorando, incluindo as informações aqui contidas, não pode ser copiado, reproduzido, republicado ou postado na íntegra ou parcialmente, em qualquer formato, sem o consentimento prévio, por escrito, da Oaktree.

