Link para o artigo original : https://www.bridgewater.com/research-and-insights/deglobalization-raises-the-value-of-geographic-diversification
Deglobalization Raises the Value of Geographic Diversification
Differences in macro conditions and the corresponding policy responses and market action are as large as they have been in 40 years. This highlights the importance and potential of geographic diversification for investors.
It’s been a long time since geographic diversification has been as important as it is today. From the 1980s through the mid-2010s, increasing global trade and capital flows caused global markets to be increasingly correlated, reducing the value of global diversification. In 2015, the de-linking of the RMB from the dollar was the first turning point in this condition. The combination of the size of the Chinese economy—and the newfound independence in monetary policy that de-linking allowed—meant that China and other locally impacted economies would now be less correlated to Western developed markets.
Then in 2020, the pandemic and opposite policy responses sent economies and ultimately their inflation rates in opposite directions, which is now sending their monetary policies in opposite directions. And even within Western markets where conditions have been more similar, easier fiscal policy in Europe and more forceful monetary tightening in the United States are setting up more divergent future conditions. Other forms of deglobalization will add to these effects. You couldn’t ask for a better set of conditions for geographic diversification.
As an illustration of just how large geographic differences have become, we show an index below of the average size of differentials in growth and inflation between economies. After spiking during the pandemic to the highest levels in the post-war period, economic differences have continued to stay elevated around the high levels of the ’80s and early ’90s. This is leading to very different policy responses, which are now causing discount rates and risk premiums across markets to diverge as well.
The analysis above is based on the All Weather Lens, which is an analytical approach to assess the behavior of the major drivers of asset performance and their impact on markets during any given period, based on Bridgewater’s understanding of global financial markets. Information shown is the result of analyses of actual and simulated market data.
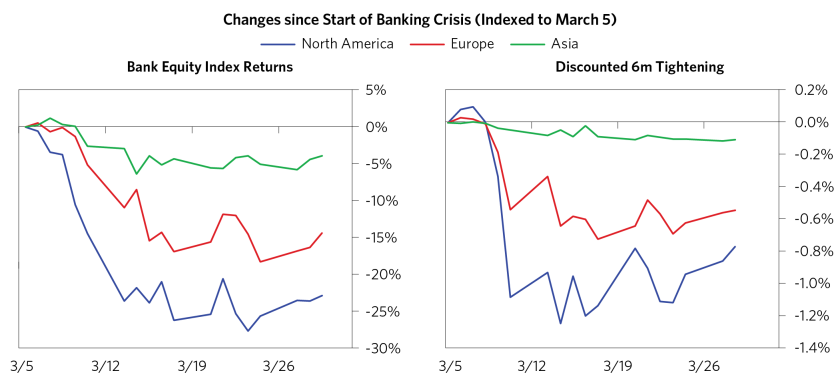
Another illustration of how different geographic conditions have become is the degree of divergences between the major economic blocs over the past month amid the banking crisis. While the day-to-day moves have been somewhat correlated, the magnitude of the market response has shown clear differentiation across regions based on how exposed they are to the US banking system crisis and the degree to which policy makers had previously tightened liquidity, rather than indiscriminate global crisis market action. This is most clearly shown in how bank equities have performed and in how the market expectations of discounted tightening have changed since the start of the banking crisis across North America, Europe, and Asia, as illustrated in the charts below. North American bank equities are down about 25% while European bank equities are down about 15%. Market discounting of monetary policy is pricing in about 75bps lower rates in North America and about 50bps lower in Europe compared to before the crisis. Asian markets have barely budged.


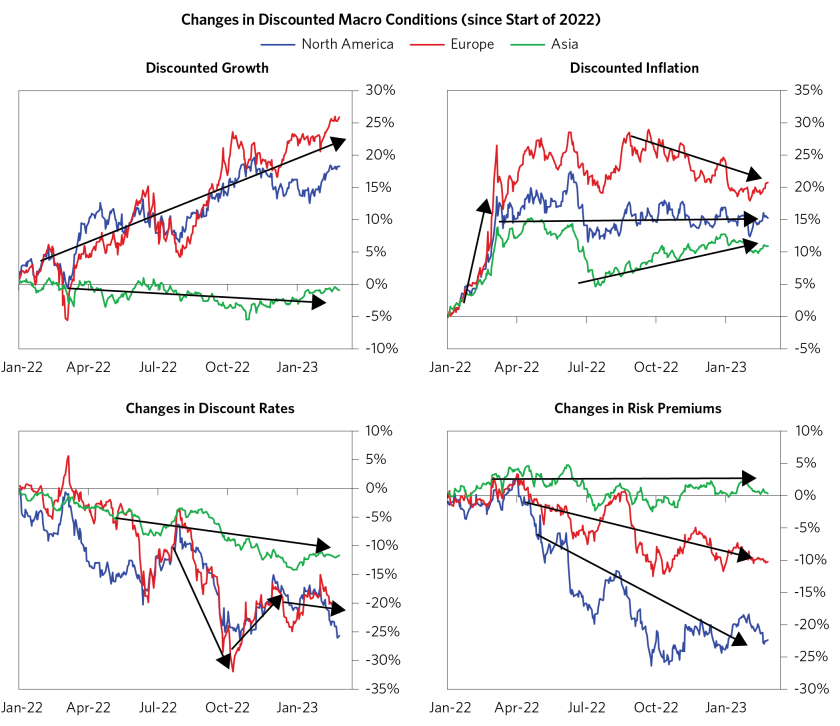
Zooming out and looking at the past year since the onset of the global tightening cycle, differences in discounted growth, discounted inflation, discount rates, and risk premiums have been very large between the Western blocs and Asia. And while the discounting has been correlated between North America and Europe, the magnitudes of the changes have been quite different, especially in discounted inflation and changes in risk premiums.
The analysis in the chart panel above is based on the All Weather Lens, which is an analytical approach to assess the behavior of the major drivers of asset performance and their impact on markets during any given period, based on Bridgewater’s understanding of global financial markets. Information shown is the result of analyses of actual and simulated market data.
Are these divergences likely to persist? Structurally, the rising independence of Europe and Asia (with China at its center) as economic blocs with their own monetary policies makes that highly likely. Whereas in the past the US dominated globalized economic and capital flows and the business cycles were more aligned, today each bloc is in a different cyclical position due to its response to the pandemic. And these cyclical differences are being compounded by today’s policy decisions and how that will influence future conditions.
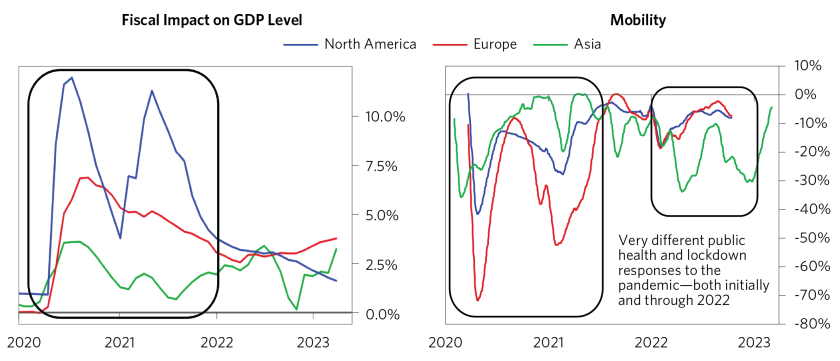
As shown below, the public health and reflationary fiscal policies during the pandemic were dramatically different across the different blocs, setting very different cyclical positions today. North America—in particular the United States—responded with two rounds of massive fiscal stimulus and moderate lockdowns that were relaxed earlier. Europe initially saw some of the most stringent lockdowns, paired with a large fiscal stimulus, but nowhere near the magnitude of what was done in the United States. And Asia saw a totally different response, in particular in China, which at first had a very controlled reopening and strong recovery that it tightened into to constrain excesses in the real estate sector. This sector then collapsed last year during the stringent lockdowns in response to Omicron, during which there was minimal offsetting fiscal stimulus.

These policy responses resulted in very different recoveries and inflation rates that are now being met with different policy responses. This will drive future conditions to be even more divergent. North America saw the rise in inflation occur first, and as a result, the Fed tightened monetary policy sooner and more aggressively than everywhere else. Europe has lagged behind North America by several months and is discounted to have further to go in its tightening cycle. European fiscal policy has also been more stimulative over the past year as policy makers responded to rising energy prices with subsidies. More recently, China has both ended its zero-COVID lockdowns and shifted toward easing in order to stimulate a weak economy.

Differences in conditions and policies have led to divergent market outcomes. North American assets saw both the most rapid gains coming out of COVID and the steepest sell-off over the past year in the face of historic Fed tightening. European assets lagged during 2020 and 2021 but have now largely closed the gap with North American markets, with European equities in particular being resilient over the past year. Asian equities have underperformed other markets since 2021, while Asian bond markets have been flat.

This research paper is prepared by and is the property of Bridgewater Associates, LP and is circulated for informational and educational purposes only. There is no consideration given to the specific investment needs, objectives or tolerances of any of the recipients. Additionally, Bridgewater’s actual investment positions may, and often will, vary from its conclusions discussed herein based on any number of factors, such as client investment restrictions, portfolio rebalancing and transactions costs, among others. Recipients should consult their own advisors, including tax advisors, before making any investment decision. This report is not an offer to sell or the solicitation of an offer to buy the securities or other instruments mentioned.
Bridgewater research utilizes data and information from public, private, and internal sources, including data from actual Bridgewater trades. Sources include BCA, Bloomberg Finance L.P., Bond Radar, Candeal, Calderwood, CBRE, Inc., CEIC Data Company Ltd., Clarus Financial Technology, Conference Board of Canada, Consensus Economics Inc., Corelogic, Inc., Cornerstone Macro, Dealogic, DTCC Data Repository, Ecoanalitica, Empirical Research Partners, Entis (Axioma Qontigo), EPFR Global, ESG Book, Eurasia Group, Evercore ISI, Factset Research Systems, The Financial Times Limited, FINRA, GaveKal Research Ltd., Global Financial Data, Inc., Harvard Business Review, Haver Analytics, Inc., Institutional Shareholder Services (ISS), The Investment Funds Institute of Canada, ICE Data, ICE Derived Data (UK), Investment Company Institute, International Institute of Finance, JP Morgan, JSTA Advisors, MarketAxess, Medley Global Advisors, Metals Focus Ltd, Moody’s ESG Solutions, MSCI, Inc., National Bureau of Economic Research, Organisation for Economic Cooperation and Development, Pensions & Investments Research Center, Refinitiv, Rhodium Group, RP Data, Rubinson Research, Rystad Energy, S&P Global Market Intelligence, Sentix Gmbh, Shanghai Wind Information, Sustainalytics, Swaps Monitor, Totem Macro, Tradeweb, United Nations, US Department of Commerce, Verisk Maplecroft, Visible Alpha, Wells Bay, Wind Financial Information LLC, Wood Mackenzie Limited, World Bureau of Metal Statistics, World Economic Forum, YieldBook. While we consider information from external sources to be reliable, we do not assume responsibility for its accuracy.
The views expressed herein are solely those of Bridgewater as of the date of this report and are subject to change without notice. Bridgewater may have a significant financial interest in one or more of the positions and/or securities or derivatives discussed. Those responsible for preparing this report receive compensation based upon various factors, including, among other things, the quality of their work and firm revenues.


