
Link para o artigo original : https://www.lordabbett.com/en-us/financial-advisor/insights/markets-and-economy/checking-in-on-high-yield-after-the-banking-sector-turmoil.html
Insight • April 17, 2023
6 min. Read
Checking in on High Yield after the Banking-Sector Turmoil

You’d be hard pressed to tell an accurate tale of what happened in leveraged credit in the first quarter just by looking at starting and ending high yield spreads. Overall, the ICE BofA U.S. High Yield Constrained Index tightened by 23 basis points (bps), masking the otherwise nearly 130-bps trading range of spreads during the quarter. (Based on data from ICE Data Indices as of March 31, 2023.) Risk assets raced out of the gate to start the year as spreads narrowed on a more favorable backdrop for credit. Sentiment changed quickly following news of the failure of Silicon Valley Bank (SVB) and other negative headlines for the banking sector, causing spreads to widen sharply in mid-March. That was followed by another reversal late in the quarter, as spreads came back in after investors became more comfortable with the ability of markets and regulators to contain any further strains on the banking system.
What are the implications of these developments for high yield investors? Here, we will take stock of:
- The relative performance of high yield versus investment grade.
- Any potential signs of rising stress in shorter maturities of high yield.
- What history tells us about high yield’s relative performance after the end of prior U.S. Federal Reserve (Fed) hiking cycles.
Calibrating High Yield to Broader Credit; Seeking Stress Signals
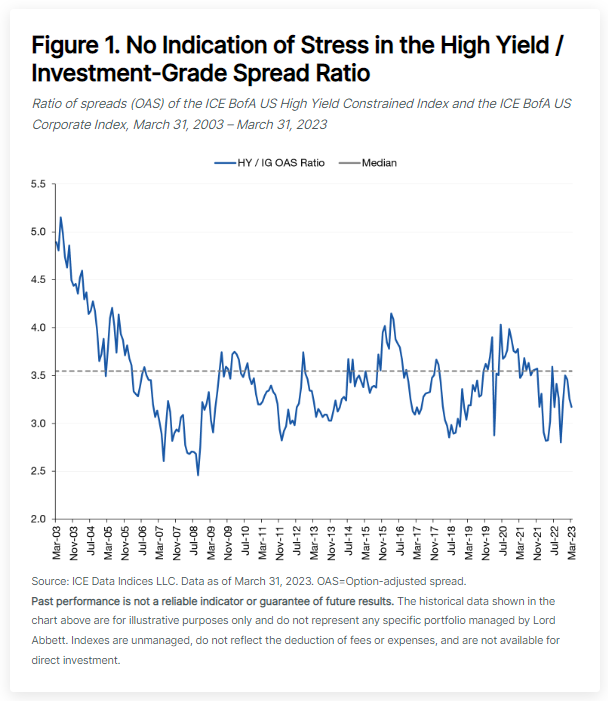
To start, we note in Figure 1 that the ratio of spread (as measured by option adjusted spreads, or OAS) in high yield to investment-grade corporates doesn’t look particularly out of place compared to the long-term median. That’s good news, as the message in the markets for now doesn’t foretell wide-ranging pain for the asset class from the tighter financial conditions that are likely to ensue following banking-sector volatility and any new regulations aimed at containing it. Through the first quarter, investment-grade corporate spreads were actually marginally wider given the heavy weighting of debt of financial services companies within the benchmark index, while high yield spreads narrowed.
A quick look to this history shows this ratio continuously declined right up until the failure of Lehman Brothers in 2008 (which precipitated the global financial crisis [GFC] of 2008–09), after which point it became clear that corporate-bond issuers generally were going to face a far more problematic financing environment as frictions in the financing markets were going to impact the real economy. Similarly, this ratio climbed during the 2015 episode of commodity-market volatility, and then again during the COVID-19 pandemic, both hitting the high yield market more squarely.
Today, we see little evidence of a similar reaction. That is not to say that investors did not acknowledge an increase in risk after the banking-sector turmoil, as CCC-rated bonds underperformed BB-rated bonds by almost 3.5% on a total return basis over the period from March 9 (right before the SVB failure) through quarter end. (Based on data from ICE Data Indices as of March 31, 2023.)
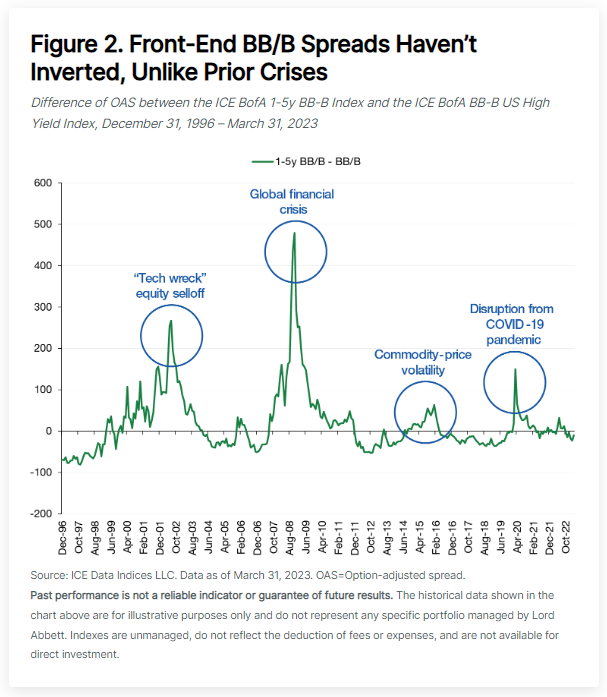
Similarly, we can segment the high yield market to explore if there is any particular stress rising in the front end of BB/B spread curves (i.e., beyond the CCC underperformance we noted above). Typically, rising worries of near-term defaults beyond just the current crop of CCCs will result in spread curve flattening as (1) investors show caution on near-term maturities and (2) prices of high yield bonds start to reflect dollar price assumptions of recovery levels more than typical risk premiums. Here again, in Figure 2, we note little stress emerging in recent weeks, unlike during the wake of the early 2000s “tech wreck,” the GFC, the 2015 commodity-price volatility, and the disruptions caused by the emergence of COVID-19 in 2020. While recent CCC underperformance should rightly be interpretated as anticipating a climb in the default rate, spread curve shape in BBs and Bs suggests a more benign environment than in prior crises.
Short-Duration Yield Compares Well to Equity Yield
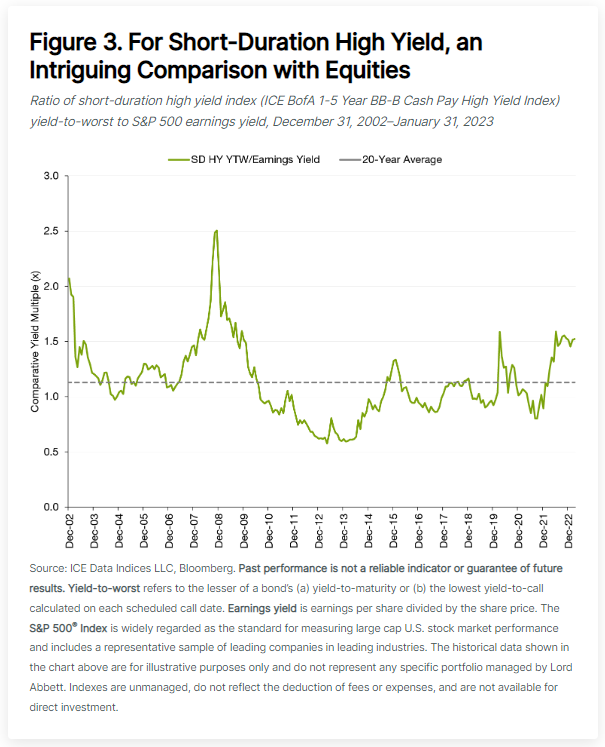
A couple of things jump out here. First, you can see that ratio today is reasonably elevated versus history. There was a big upward move in this ratio during the GFC, and again during the pandemic. But what’s notable here is that when you look at today’s comparative yield ratio between these asset classes, this doesn’t persist for very long periods of time.
How might this be resolved? Historically, it means that either yields in credit rally, and sometimes that’s driven by either a normalization of the yield curve or tightening of credit spreads. Or the earnings yield in the equity market has to climb, coming either through earnings growth or share-price declines.
So, without taking a specific view on all segments of the equity market, we think there is potentially a compelling headline-relative-value opportunity between the credit markets and the equity markets. The opportunity for equity-like returns in credit markets seems very viable.
How Have Segments of High Yield Performed Following the End of Fed Hiking Cycles?
As of this writing, futures markets are pricing in a peak in the fed funds rate just over 5% at the June meeting of the Fed’s policy-setting committee and easing thereafter. While we push back on assumptions of Fed cutting rates in the second half of 2023, given that core inflation remains sticky and well above the Fed’s target, it’s clear that some investors are starting to contemplate how to position should the Fed start to ease. Can short-duration assets perform if the Fed has paused its rates hikes, is about to start easing, or if we face a recession? While every cycle is different, the Fed pauses of early 2000 and mid-2006 can provide some historical context.
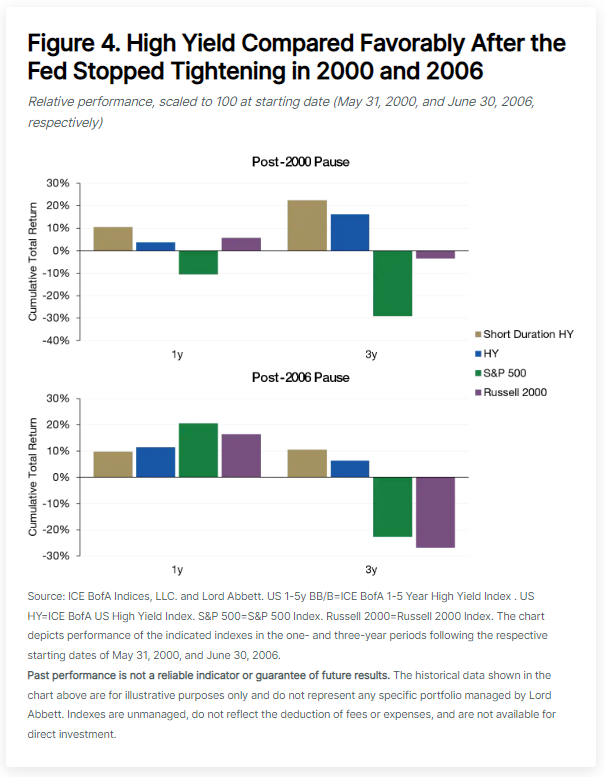
In Figure 4, we track the relative performance of short-duration BB/B-rated high yield, the full high yield index, the S&P 500, and the Russell 2000® Index (which typically correlates better to the value-oriented high yield market than the growth-skewed S&P 500) after the Fed reached its terminal rate at the end of these two hiking campaigns. Over the ensuing one- and three-year periods, high yield experienced favorable relative, and positive total cumulative returns, short-duration high yield in particular. One exception where equities did outperform was in the one-year period following the 2006 pause, through to mid-2007. However, a look to the full three-year period showed relative resilience in credit.
Summing Up
Despite the banking-sector volatility experienced in the first quarter of 2023, the high yield market has demonstrated resilience, with no clear signs of widespread stress. Historical data suggest that high yield assets, particularly the short-duration and higher-quality segments of the market, can perform favorably once the Federal Reserve pauses its tightening cycle. (Markets are expecting that to occur after an expected 25 bps hike in May 2023.) The recent underperformance of CCCs compared to BBs indicates a cautious approach by investors, while the performance of BBs and Bs suggests a more benign environment than in previous crises. Moreover, the comparison between short-duration high yield and equity yields presents an intriguing relative-value opportunity, offering the potential for equity-like returns in the credit markets.
We have long emphasized the potential benefits of adopting a strategic mindset and actively managed approach to collecting income in leveraged credit sectors such as high yield. We think the same conditions hold true today, and particularly so, given the likely divergence of pockets of credit at times of uncertainty. Despite this uncertainty surrounding the banking sector, the U.S. economy, and the Fed’s future policy path, we believe U.S. high yield’s resiliency thus far suggests the asset remains an attractive choice for investors, especially given the current yield available in the market.
About the Author
Riz Hussain
Investment Strategist, Leveraged Credit
Riz Hussain helps drive the development and communication of information regarding the firm’s investment capabilities, strategies and market outlook to clients and prospects across the leveraged credit market. Mr. Hussain also participates inproduct development and actively monitors industry activity to ensure Lord Abbett continues to offer competitive solutions in the marketplace to meet investor needs.
As informações aqui contidas estão sendo fornecidas pela GAMA Investimentos (“Distribuidor”), na qualidade de distribuidora do site. O conteúdo deste documento [e informações neste site] contém informações proprietárias sobre LORD ABBETT e o Fundo. Nenhuma parte deste documento nem as informações proprietárias do LORD ABBETT ou DO Fundo aqui podem ser (i) copiadas, fotocopiadas ou duplicadas de qualquer forma por qualquer meio (ii) distribuídas sem o consentimento prévio por escrito do LORD ABBETT. Divulgações importantes estão incluídas ao longo deste documento e que devem ser utilizadas exclusivamente para fins de análise do LORD ABBETT e do Fundo. Este documento não pretende ser totalmente compreendido ou conter todas as informações que o destinatário possa desejar ao analisar o LORD ABBETT e o Fundo e/ou seus respectivos produtos gerenciados ou futuramente gerenciados. Este material não pode ser utilizado como base para qualquer decisão de investimento. O destinatário deve confiar exclusivamente nos documentos constitutivos de qualquer produto e em sua própria análise independente. Nem o LORD ABBETT nem o Fundo estão registrados ou licenciados no Brasil e o Fundo não está disponível para venda pública no Brasil. Embora a Gama e suas afiliadas acreditem que todas as informações aqui contidas sejam precisas, nenhuma delas faz qualquer declaração ou garantia quanto à conclusão ou necessidades dessas informações.
Essas informações podem conter declarações de previsões que envolvem riscos e incertezas; os resultados reais podem diferir materialmente de quaisquer expectativas, projeções ou previsões feitas ou inferidas em tais declarações de previsões. Portanto, os destinatários são advertidos a não depositar confiança indevida nessas declarações de previsões. As projeções e/ou valores futuros de investimentos não realizados dependerão, entre outros fatores, dos resultados operacionais futuros, do valor dos ativos e das condições de mercado no momento da alienação, restrições legais e contratuais à transferência que possam limitar a liquidez, quaisquer custos de transação e prazos e forma de venda, que podem diferir das premissas e circunstâncias em que se baseiam as perspectivas atuais, e muitas das quais são difíceis de prever. O desempenho passado não é indicativo de resultados futuros.


