Link para o artigo original : https://www.bridgewater.com/research-and-insights/equity-markets-arent-pricing-in-the-next-stage-of-the-tightening-cycle
Equities are discounting higher interest rates but not the tightening’s impact on growth and earnings or the possibility that even more tightening will be needed to bring inflation down.
Equity returns in the first half of this year made a lot of sense. When it became apparent that high inflation was self-sustaining and that the Fed and other central banks were behind the curve and would have to tighten more aggressively, all asset yields rose, including the yields on equities. For equities, yields rising is the only thing that happened. The discounted path of earnings barely changed, implying that the battle against inflation would be an easy one with virtually no collateral damage to economies and earnings. Just looking at the level of P/Es today, one could interpret them as being back to their mid-ranges and equities as offering at least a normal risk premium to bonds.
However, unlike a bond, the actual future yield on equities is no known because it is a function of the future level of earnings. An interpretation that equity yields were/are attractive depends on a key assumption—that the tightening cycle that brings inflation down to central bank targets will not cause an economic downturn or a decline in earnings. If bringing inflation down does require a tightening cycle that reduces earnings, then the future earnings yield of equities has not risen at all. And if that tightening cycle also continues to push bond yields higher, then an unchanged yield on equities will be increasingly uncompetitive with the rise in bond yields, requiring a decline in prices to reflect both the lower level of earnings and the higher level of bond yields. If the tightening priced in doesn’t slow the economy and earnings don’t fall, then more tightening will likely be required to bring inflation under control (putting further pressure on discount rates and equity prices).
While in most recent tightening cycles both nominal and real growth fell as the central banks raised rates to control inflation, today it’s likely that inflation stays high and nominal growth remains strong in this transition period, as it takes time for the tightening to flow through (and the starting point for inflation is so elevated). These conditions would result in reasonable nominal revenue growth, but equities would still face headwinds as margins and earnings come under pressure. We will be following up on this topic soon.
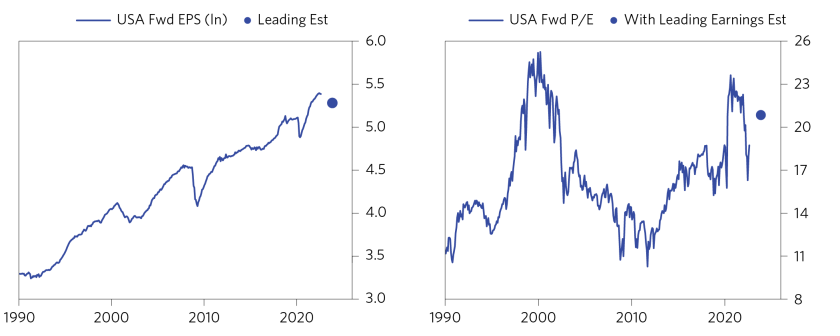
Below, we show the earnings that analysts are projecting for US equities as well as the P/E based on that number (in the historical mid-range, decent valuation today). We also show a dot that represents what our estimates suggest earnings will be given the tightening that has happened so far and the inflation we expect, as well as the associated P/E given that estimated level of earnings (near historical highs, poor valuation).

We believe that where we are in the current tightening cycle will result in some mix of weaker growth, higher rates, and/or stubbornly high inflation, with the mix to be determined by the decisions of central banks. All of these outcomes present risks to equities that investors need to consider. In the remainder of this report, we discuss the following dynamics in more detail: 1) how major tightening cycles both impact the yields on all assets (including equities) and flow through to the economy and earnings with a lag; and 2) how where we are in the current tightening cycle is especially risky for equities, since most of the earnings impact is ahead of us and further tightening may be needed to bring down inflation.
How Major Tightening Cycles Typically Impact Asset Yields and Equities
Tightening cycles are bad for all assets because as discount rates rise, the present value of the future cash flows those assets represent falls. To entice investors away from cash and into assets, the yields on the assets must rise to reflect this change in discounting. Below, we show developed world asset yields alongside short rates (with an estimate that reflects what the impact of QE/QT would translate to in interest-rate terms to illustrate the full underlying change in monetary policy). As you can see, asset yields adjust upward alongside short rates. As rates rose this year, we saw the asset yields in the developed world rise (with a small pullback recently). Such tightening environments, when cash is becoming more attractive, are terrible for the returns of almost all financial assets, as the rising discount rates and risk aversion weigh on prices.

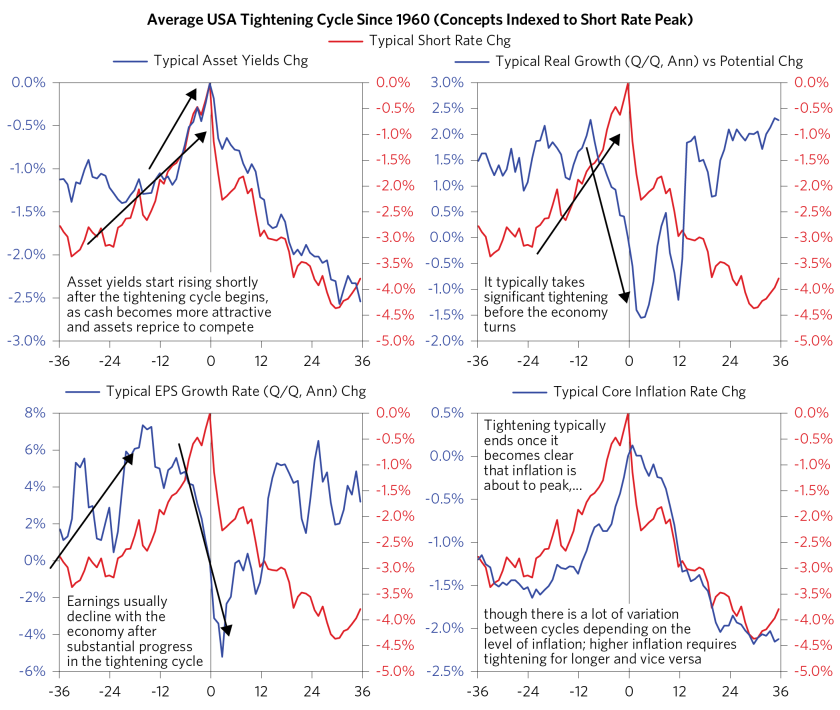
The charts below highlight how the typical tightening cycle unfolds and the lead-lag relationships between short rates, asset yields, the economy, and earnings. While the flow-through of rising short rates to asset yields is fast, given the self-reinforcing nature of the economy, it usually takes some time for the tightening to crack the economy and for earnings to decline. Inflation comes down with a lag to the decline in the real economy, and the tightening cycle doesn’t end until it is clear that inflation will soon come down to reasonable levels.

Equities are most vulnerable during the period when earnings decline and there is continued tightening and rising asset yields since inflation isn’t yet fully contained. The table below illustrates this—the combination of rising asset yields and EPS declines are by far the worst periods for equities. In this current cycle, we are still in a transition phase and haven’t yet reached the point where reported earnings or analyst forward EPS expectations have started to come down.

How and When This Tightening Cycle Hits the Real Economy and Earnings Expectations Will Be Critical for Equity Returns from Here
As noted above, so far in the current tightening cycle, equity prices have fallen (and recently seen some reversal) in response to the changes in discount rates. They are still not discounting a decline in earnings. We show two perspectives on this discounting below. When we simply adjust for the impact of higher rates using conservative duration assumptions, equities are mostly flat (or a bit up). Analyst earnings estimates are also so far showing almost no change from before the Fed tightening.

Given this, when markets begin to discount lower earnings, prices will likely take a hit. Our study of past bear markets shows how the main difference between a correction (10-20% decline) and a bear market (greater than 20% decline) is the extent to which the contraction in liquidity and rise in risk premiums passes through to an economic contraction and decline in earnings. You see this in the data shown below, covering 41 bear markets and 30 corrections over the past 100 years in the four largest developed world markets. In corrections of 10-20%, the price decline is mainly comprised of a fall in P/Es due to a rise in discount rates and risk premiums. In bear market declines of 20% or more, the price impact from an earnings decline is much larger due to a deeper contraction in the economy and cash flows.

The tightening is already well underway. Starting this year, the Fed began rapidly withdrawing the liquidity that supported financial assets after the COVID shock (through both nominal rates at zero and a massive QE program). We are now in the transition period where the tightening is occurring and its impacts are beginning to work their way through the economy.

As shown above, it takes some time for the tightening to really hit the real economy. We have already seen growth slow to around zero, and unless things change (such as a material move to easing by the Fed and a relaxing in financial conditions), we expect this tightening to flow through to a contraction in real growth in the coming months. Below, we show our leading real growth estimate and its translation to US corporate earnings.

We think it is likely that this tightening cycle will continue because inflation is still much higher than target (despite recent moderation), with the continued strength in the labor market adding upward pressure. Below, we show what it has historically taken to bring inflation at high levels back to target given the self-reinforcing nature of wages, spending, and hiring. Historically, inflation has never come back to target from levels like today’s without a sizable increase in or high level of unemployment. The unemployment rate today is near secular lows.

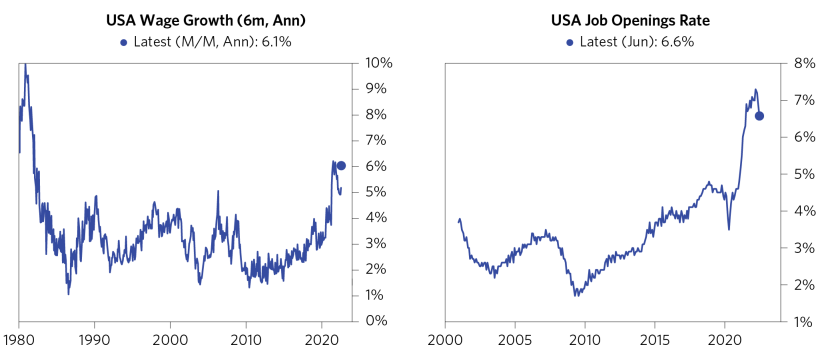
At this point, wage inflation is still running red hot amid a very tight labor market. Wage gains are stronger than at any point since the 1980s and job openings are not far off record highs, suggesting that labor demand remains strong and that companies will be pressed to continue offering wage increases. This suggests more tightening will likely be needed to weaken the labor market and bring wage growth down, even as the one-off pressures on inflation abate.

This research paper is prepared by and is the property of Bridgewater Associates, LP and is circulated for informational and educational purposes only. There is no consideration given to the specific investment needs, objectives or tolerances of any of the recipients. Additionally, Bridgewater’s actual investment positions may, and often will, vary from its conclusions discussed herein based on any number of factors, such as client investment restrictions, portfolio rebalancing and transactions costs, among others. Recipients should consult their own advisors, including tax advisors, before making any investment decision. This report is not an offer to sell or the solicitation of an offer to buy the securities or other instruments mentioned.
Bridgewater research utilizes data and information from public, private and internal sources, including data from actual Bridgewater trades. Sources include, Arabesque ESG Book, Bloomberg Finance L.P., Bond Radar, Candeal, Capital Economics, CBRE, Inc., CEIC Data Company Ltd., Clarus Financial Technology, Conference Board of Canada, Consensus Economics Inc., Corelogic, Inc., Cornerstone Macro, Dealogic, DTCC Data Repository, Ecoanalitica, Empirical Research Partners, Entis (Axioma Qontigo), EPFR Global, Eurasia Group, Evercore ISI, Factset Research Systems, The Financial Times Limited, FINRA, GaveKal Research Ltd., Global Financial Data, Inc., Harvard Business Review, Haver Analytics, Inc., Institutional Shareholder Services (ISS), The Investment Funds Institute of Canada, ICE Data, ICE Derived Data (UK), Investment Company Institute, International Institute of Finance, JP Morgan, MarketAxess, Medley Global Advisors, Metals Focus Ltd, Moody’s ESG Solutions, MSCI, Inc., National Bureau of Economic Research, OAG Aviation, Organisation for Economic Cooperation and Development, Pensions & Investments Research Center, Refinitiv, Rhodium Group, RP Data, Rystad Energy, S&P Global Market Intelligence, Sentix Gmbh, Shanghai Wind Information, Sustainalytics, Swaps Monitor, Totem Macro, Tradeweb, United Nations, US Department of Commerce, Verisk Maplecroft, Visible Alpha, Wells Bay, Wind Financial Information LLC, Wood Mackenzie Limited, World Bureau of Metal Statistics, World Economic Forum, YieldBook. While we consider information from external sources to be reliable, we do not assume responsibility for its accuracy.
The views expressed herein are solely those of Bridgewater as of the date of this report and are subject to change without notice. Bridgewater may have a significant financial interest in one or more of the positions and/or securities or derivatives discussed. Those responsible for preparing this report receive compensation based upon various factors, including, among other things, the quality of their work and firm revenues.

