Link para o artigo original: https://www.bridgewater.com/research-and-insights/breaking-down-the-sources-of-us-economic-resilience
One way to understand how the cycle is playing out is by breaking down the spending in the economy into its sources: incomes, borrowing, and changes in saving. Private sector borrowing has been crushed by the tightening and households have stopped reducing their savings, but strong income growth has outweighed these drags and will likely take more than just the tightening to date to crack.
We’re currently experiencing an unusual economic cycle from an income and credit perspective. Despite a large, rapid monetary tightening, the economy remains strong—supported by high levels of income growth that have anchored the ongoing expansion, even as the tightening has been a drag on activity through the usual channels.
Generally, a dollar spent in the economy can come from one of three places: the spender can use their incomes (e.g., wages for households, profits for businesses, or tax collections for the government); the spender can borrow the money; or the spender can use the savings they’ve built up in past periods. Across economic cycles, this usually plays out in the following way:
- Income growth finances most economic spending, and there is a self-reinforcing aspect to a cycle powered by incomes, as one person’s spending becomes another’s income.
- Borrowing makes cycles more extreme, on both the upside and the downside. Borrowing to spend in excess of income growth adds fuel into the fire of a cycle, and an upswing in borrowing can last a while—but eventually, borrowers reach their debt limits, and higher rates make servicing debts more expensive. Borrowing is susceptible to sharp reversals, which can quickly turn the cycle (as we saw in 2008).
- Spending from savings is usually short-lived, for pretty obvious reasons: you can’t draw down your savings indefinitely. And when central banks tighten, rising rates discourage spending down savings by offering a more attractive yield on the money.
Stacking up conditions today against those typical drivers, the following dynamics stand out:
- Private sector borrowing has been crushed by the tightening. As rising rates have flowed through to the economy, the contraction in household and corporate borrowing has been as large as typically occurs, even during severe recessions, which has contributed to a dramatic cooling in private sector spending growth from unsustainable levels. On the other hand, public sector borrowing has risen with the expanding government deficit, supporting household and business incomes and blunting the impact of the private sector credit contraction. Looking forward, fiscal policy is unlikely to pull back meaningfully, and at this point the monetary tightening’s impact on borrowing is mostly behind us, as private borrowing is no longer contracting.
- Household dissaving has been unusually large this cycle and has normalized as well. Households saved massive amounts during COVID when they received large checks of government support—and the subsequent spending down of these savings was an abnormally large boost to this cycle. Now, saving pressures are roughly back to neutral, with household savings rates stabilizing as well.
- When borrowing sharply turns down and households stop reducing their savings, the cycle usually turns. This hasn’t happened because household income has continued to accelerate, supporting an ongoing increase in spending that has outweighed the drags from the rollover of borrowing and dissaving. This dynamic is inherently self-sustaining and will likely take more than just the tightening to date to crack.
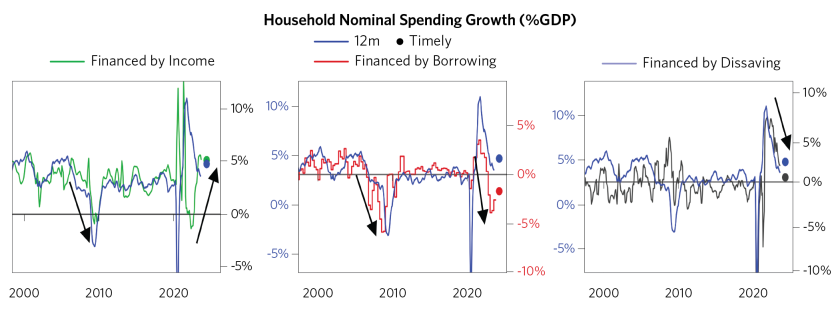
In the rest of this report, we go through the major players with these drivers in mind. We begin with households, which represent about three-quarters of the economy. The charts below show an attribution of nominal household spending growth into the above drivers. Household borrowing has massively contracted—as sharply as we saw in the financial crisis—and the supports to spending from dissaving have rolled over. But accelerating incomes have kept demand anchored at levels consistent with a healthy expansion.
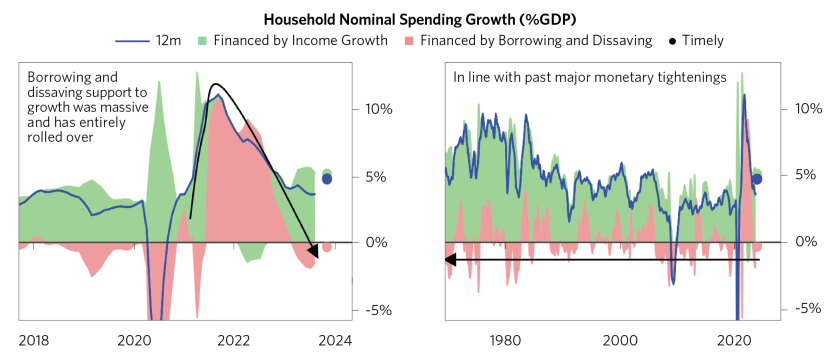
The next charts show the same attribution combining borrowing and dissaving, highlighting how unusually large the combination has been as a driver of this cycle. In late 2021 through roughly the middle of last year, as the fiscal supports rolled off and inflation began to accelerate, households experienced a significant slowdown in nominal incomes and a significant outright contraction in real incomes. At the same time, nominal demand remained hot, fueled by a historically large wave of dissaving, as households took advantage of extremely strong balance sheets and easy financial conditions to grow their spending far in excess of their incomes. Since the tightening began, that dynamic has largely reversed as you would expect: borrowing has collapsed, and the aggregate impact on spending from credit and dissaving has contracted from a peak 10% support to nominal growth to roughly a 2% drag—consistent with the impact of a large tightening of financial conditions. However, that drag has been partially offset by strong income growth during the same time—particularly real income growth, as the fall in commodity prices and normalization of supply chains pressures has flowed through to lower headline inflation. Thus far, this has netted to slowing nominal spending but real spending holding up in accordance with real income growth rising.
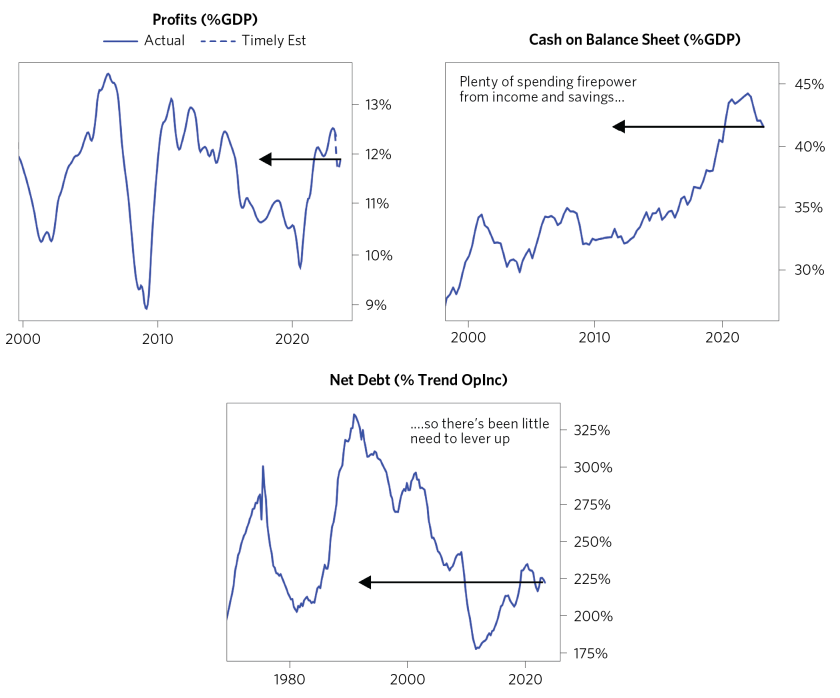
This income and credit perspective is most pertinent to households but applies to other sectors as well. Businesses generally decide whether to spend based on the demand they are facing, and today they look well-positioned to reinforce the cycle: balance sheets look healthy, and they have plenty of room to borrow to finance spending as needed. Most importantly, business income growth has been strong, such that businesses largely haven’t needed to lever up very much over the course of this cycle in order to finance an expansion in spending on labor and capex.
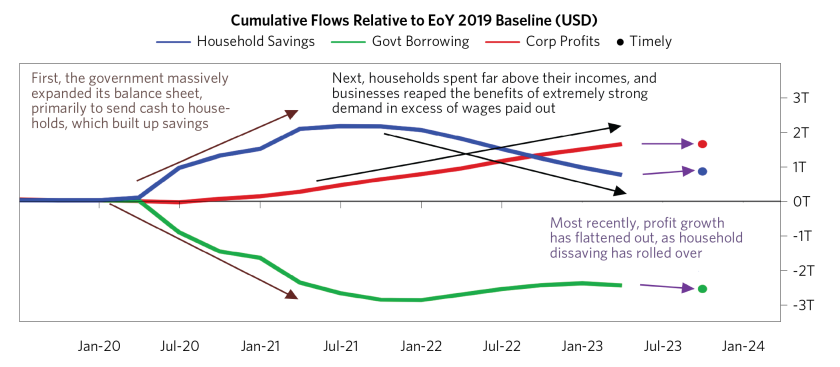
Examining the strength in business profits, businesses’ surge in profitability has been financed by the borrowing and dissavings of households and the government. First, the government injected trillions of dollars of stimulus into the economy, with most going out as direct transfers to households in businesses—this enabled businesses to effectively receive demand for their products that wasn’t supported by incomes they paid through wages. In other words, businesses fired many workers during COVID, but those workers didn’t have to cut their spending on what the businesses produced, supporting profits. The government’s transfers partly ended up on household balance sheets as savings, so as the government deficit stabilized at high levels, households spent down the savings and further supported business profits (i.e., another source of demand for their products that the businesses didn’t pay for in wages).
Businesses have significantly slowed their borrowing as the tightening has worked its way through the economy—but they haven’t needed to pull back on their real economy spending on labor or capex, as high levels of income and accumulated savings have provided plenty of fuel for spending without the need to leverage up. Most of the expansion in business borrowing this cycle went to fund financial spending, and the pullback has mostly flowed through there as well, limiting the impact on the real economy.

As the charts below show, businesses haven’t needed to borrow very much at all this cycle, such that net leverage today looks benign relative to past cyclical peaks.
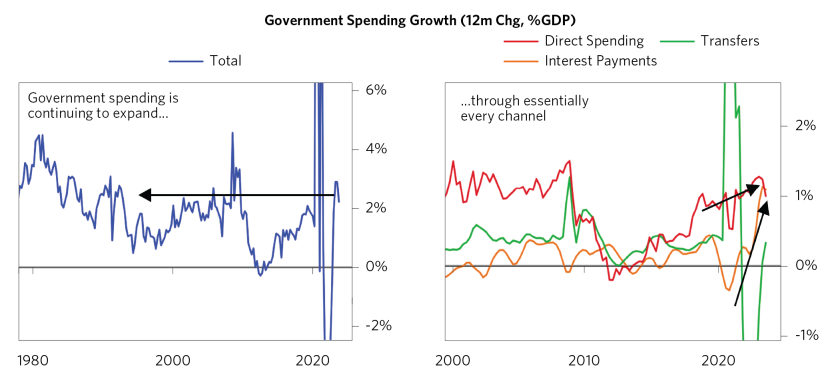
Lastly, the large ongoing budget deficit is supporting the expansion as well. Each major channel of government spending has expanded over the past year: direct spending, which directly flows through to demand and GDP and is set to remain high due to legislative priorities, e.g., past infrastructure bills and ongoing defense spending increases; transfers, which will continue to rise as spending on social programs increases due to aging populations and higher inflation being locked in through COLAs; and interest payments, which will also continue to rise as the need to refinance at higher interest rates flows through the government debt stack.
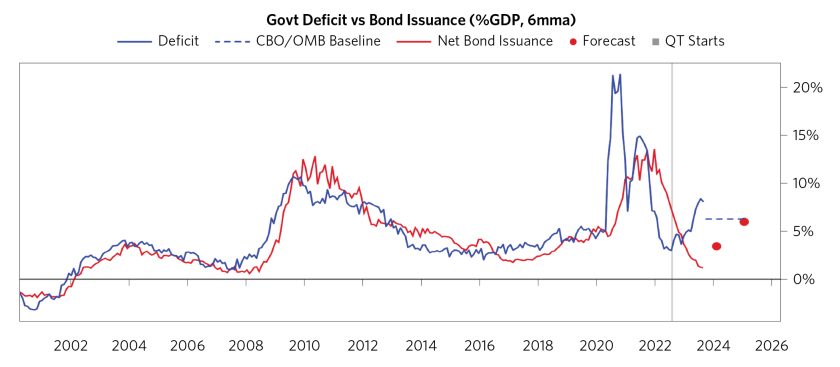
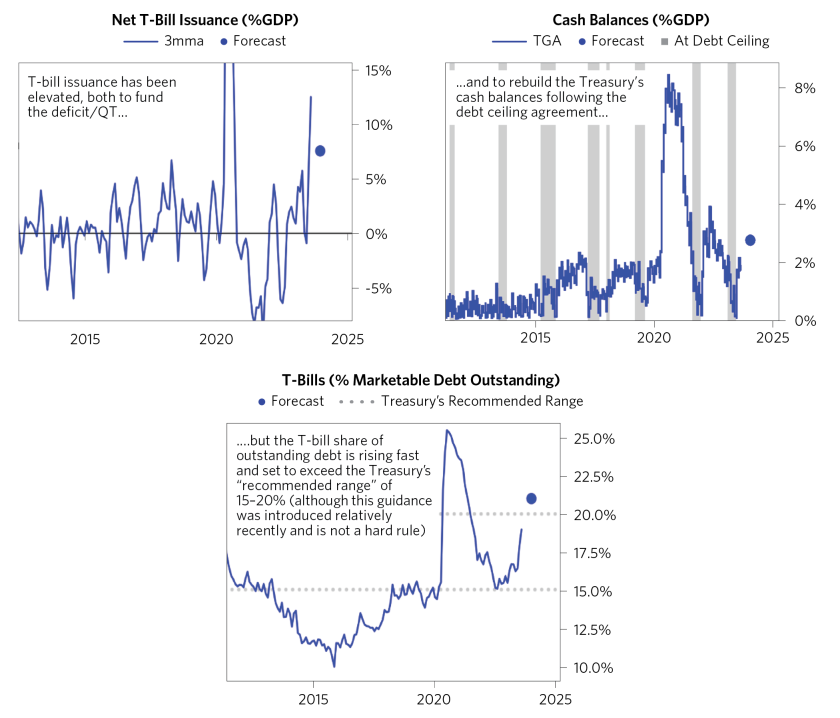
The impact on markets of the government’s expanded financing need is largely still ahead of us. Over the past year, the government has funded essentially all of the increase in its deficit by issuing T-bills and spending down its cash reserves rather than significantly ramping up the issuance of duration to the market. As a result, Treasury issuance hasn’t needed to entice money out of other cash and asset markets, and thus the impact of the expanded deficit on liquidity has been minimal thus far.
That said, we think this pressure is delayed rather than eliminated: looking forward, we expect that the Treasury will shift its mix of issuance toward more duration, as the budget deficit remains elevated and the share of bills outstanding rises through the range that the Treasury generally prefers to target (though there is plenty of flexibility around the precise proportion). We expect this combination of forces—the Treasury needing to issue more debt at the same time as the Fed is continuing to sell bonds via QT—to add a significant amount of duration to the market, pulling money out of cash and assets and, all else equal, resulting in higher interest rates and lower asset prices.
This research paper is prepared by and is the property of Bridgewater Associates, LP and is circulated for informational and educational purposes only. There is no consideration given to the specific investment needs, objectives, or tolerances of any of the recipients. Additionally, Bridgewater’s actual investment positions may, and often will, vary from its conclusions discussed herein based on any number of factors, such as client investment restrictions, portfolio rebalancing and transactions costs, among others. Recipients should consult their own advisors, including tax advisors, before making any investment decision. This material is for informational and educational purposes only and is not an offer to sell or the solicitation of an offer to buy the securities or other instruments mentioned. Any such offering will be made pursuant to a definitive offering memorandum. This material does not constitute a personal recommendation or take into account the particular investment objectives, financial situations, or needs of individual investors which are necessary considerations before making any investment decision. Investors should consider whether any advice or recommendation in this research is suitable for their particular circumstances and, where appropriate, seek professional advice, including legal, tax, accounting, investment, or other advice.
The information provided herein is not intended to provide a sufficient basis on which to make an investment decision and investment decisions should not be based on simulated, hypothetical, or illustrative information that have inherent limitations. Unlike an actual performance record simulated or hypothetical results do not represent actual trading or the actual costs of management and may have under or overcompensated for the impact of certain market risk factors. Bridgewater makes no representation that any account will or is likely to achieve returns similar to those shown. The price and value of the investments referred to in this research and the income therefrom may fluctuate. Every investment involves risk and in volatile or uncertain market conditions, significant variations in the value or return on that investment may occur. Investments in hedge funds are complex, speculative and carry a high degree of risk, including the risk of a complete loss of an investor’s entire investment. Past performance is not a guide to future performance, future returns are not guaranteed, and a complete loss of original capital may occur. Certain transactions, including those involving leverage, futures, options, and other derivatives, give rise to substantial risk and are not suitable for all investors. Fluctuations in exchange rates could have material adverse effects on the value or price of, or income derived from, certain investments.
Bridgewater research utilizes data and information from public, private, and internal sources, including data from actual Bridgewater trades. Sources include BCA, Bloomberg Finance L.P., Bond Radar, Candeal, Calderwood, CBRE, Inc., CEIC Data Company Ltd., Clarus Financial Technology, Conference Board of Canada, Consensus Economics Inc., Corelogic, Inc., Cornerstone Macro, Dealogic, DTCC Data Repository, Ecoanalitica, Empirical Research Partners, Entis (Axioma Qontigo), EPFR Global, ESG Book, Eurasia Group, Evercore ISI, FactSet Research Systems, The Financial Times Limited, FINRA, GaveKal Research Ltd., Global Financial Data, Inc., Harvard Business Review, Haver Analytics, Inc., Institutional Shareholder Services (ISS), The Investment Funds Institute of Canada, ICE Data, ICE Derived Data (UK), Investment Company Institute, International Institute of Finance, JP Morgan, JSTA Advisors, MarketAxess, Medley Global Advisors, Metals Focus Ltd, Moody’s ESG Solutions, MSCI, Inc., National Bureau of Economic Research, Organisation for Economic Cooperation and Development, Pensions & Investments Research Center, Refinitiv, Rhodium Group, RP Data, Rubinson Research, Rystad Energy, S&P Global Market Intelligence, Sentix Gmbh, Shanghai Wind Information, Sustainalytics, Swaps Monitor, Totem Macro, Tradeweb, United Nations, US Department of Commerce, Verisk Maplecroft, Visible Alpha, Wells Bay, Wind Financial Information LLC, Wood Mackenzie Limited, World Bureau of Metal Statistics, World Economic Forum, YieldBook. While we consider information from external sources to be reliable, we do not assume responsibility for its accuracy.
This information is not directed at or intended for distribution to or use by any person or entity located in any jurisdiction where such distribution, publication, availability, or use would be contrary to applicable law or regulation, or which would subject Bridgewater to any registration or licensing requirements within such jurisdiction. No part of this material may be (i) copied, photocopied, or duplicated in any form by any means or (ii) redistributed without the prior written consent of Bridgewater® Associates, LP.
The views expressed herein are solely those of Bridgewater as of the date of this report and are subject to change without notice. Bridgewater may have a significant financial interest in one or more of the positions and/or securities or derivatives discussed. Those responsible for preparing this report receive compensation based upon various factors, including, among other things, the quality of their work and firm revenues.

