Link para o artigo original:https://www.man.com/maninstitute/where-are-we-in-the-credit-cycle-2024

An environment built for active managers, not for indiscriminate beta players.
FEBRUARY 2024
Introduction
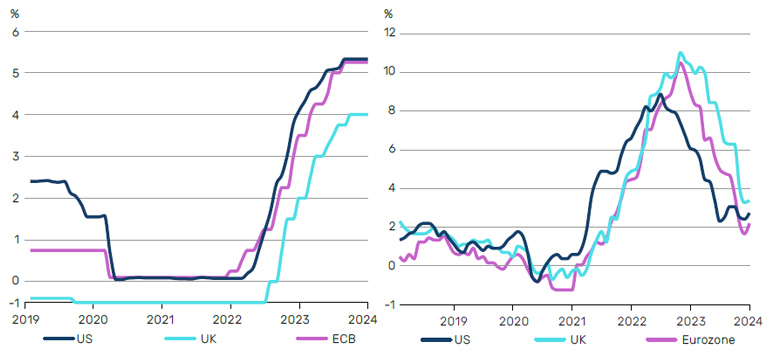
Over the past 18 months, we have seen one of the most aggressive rate hiking cycles in decades as central banks have sought to counteract a very high inflationary environment. Fed fund futures rose to 5.5% from close to 0% in 2022, with US interest rates reaching the highest level since 2001.
US inflation has since decelerated from its June 2022 peak of 9.1% and we have seen Eurozone and UK inflation follow a similar trajectory. Inflation is expected to continue slowing and while we have likely seen the last rate hikes from both the European Central Bank (ECB) and the US Federal Reserve (Fed), resilience in recent economic data suggests companies should get used to an environment of higher rates for longer.
Figure 1 and 2. Most aggressive rate hiking cycle in decades; Inflation falling but still persistently above 2%
Source: Bloomberg, as at 31 December 2023.
“The annals of history suggest pain is coming, although the next catalyst, be it geopolitical, sectoral or idiosyncratic, remains unknown.”
Recessions closely follow Fed hiking cycles and are inextricably linked to the end of a credit cycle. To date, the US economy has been fairly resilient. Indeed, many expected the slowdown which typically occurs when rates are higher to have happened already. Arguably massive monetary stimulus and fiscal largesse, particularly in the wake of the Covid-19 economic downturn and in the aftermath of the collapse of Silicon Valley Bank, protected corporate balance sheets and consumer savings and artificially raised prices. This has led to it taking a little longer to move to the next phase of the cycle. The annals of history suggest pain is coming, although the next catalyst, be it geopolitical, sectoral or idiosyncratic, remains unknown.

First small cracks
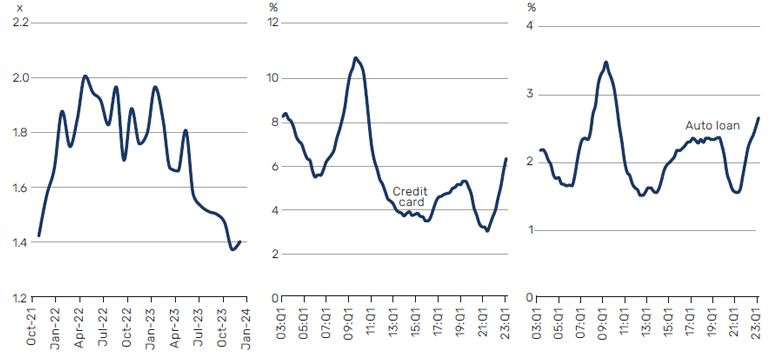
Below we show three charts which perhaps indicate that the first small cracks are beginning to appear. As shown in Figure 4, the number of US job openings per job seeker have recently fallen from 2x to 1.4x. In addition, we are seeing auto and credit card delinquencies picking up and we expect to see further deterioration from here.
Figure 4, 5 and 6. Number of US job openings per job seeker falling; US credit card delinquencies are the highest in 12 years; US auto loan delinquencies are at prepandemic levels
Source: US Bureau of Labor Statistics, New York Fed Consumer Credit Panel/Equifax, as at 31 December 2023. Shows percentage of credit card and auto loans which are 90 days or more delinquent.
Valuations not reflective of interest rate environment
Against this economic backdrop, it is somewhat surprising that valuations are not reflecting that interest rates are the highest that they have been for the last 15 years. This is most clearly evidenced by more than 60% of the high yield market paying a spread of less than 300 basis points.
“At this point in the cycle, we would expect to see differentiation between the cyclical and non-cyclical parts of the market.”
At this point in the cycle, we would expect to see differentiation between the cyclical and non-cyclical parts of the market. Specifically, we would expect to see widening in the more cyclical parts of the credit market, such as those sectors with typically lower margins or less pricing power, but valuations broadly remain tight.
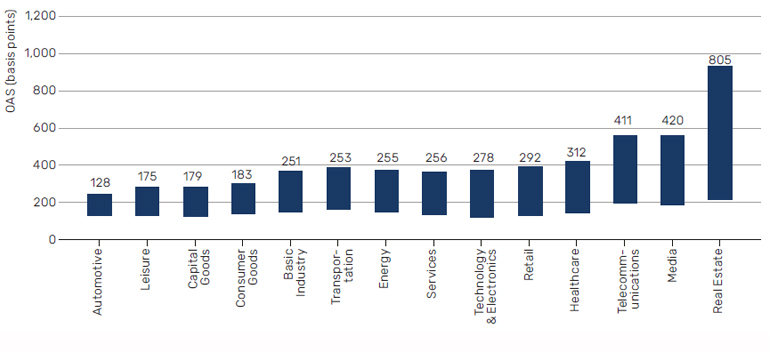
Figure 7 depicts the level of dispersion across non-financial sectors in the high yield universe, as measured by the interquartile range of the credit spreads of bonds within each sector. The obvious outlier is real estate, where valuations are more reflective of the pain of higher rates, perhaps due to the more direct linkage between commercial mortgages and underlying interest rates compared to other sectors. As referenced above, the underlying strength of the consumer, in terms of legacy Covid savings and overall disposable income, may also have contributed to less dispersion being observed in other sectors. It is also notable that aside from real estate, most distress is to be found in areas such as media and telecommunications which have historically been seen as safe and stable sectors.
Figure 7. High yield non-financial sectors ordered in terms of dispersion (interquartile range of OAS)
Source: Man GLG, ICE Data Indices, OAS as of 19 January 2024.
“We expect defaults to tick up, but not to increase dramatically.”
Storm clouds on the horizon
From a fundamentals perspective, we are beginning to see a slight weakening, with some companies having less cushion to pay down their outstanding debts (as shown in Figure 8 below). As a consequence, we expect defaults to tick up, but not to increase dramatically.
Leverage has normalised since the pandemic induced spike of 2020 and remains close to levels seen for much of the 2010s (Figure 9). A more significant weakening can be observed in the interest coverage ratios, which shows that companies have less cushion to pay down their debts.
Figure 8. Interest coverage ratios are trending downwards
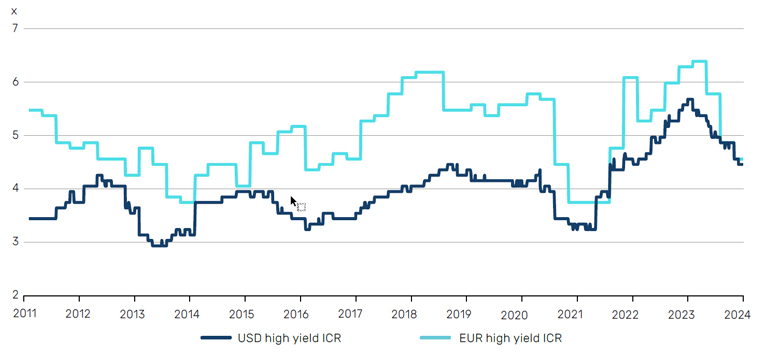
Source: Bank of America HY Credit Chartbook. The interest coverage ratio (EBITDA/interest expense) is used to determine how easily a company can pay interest on its outstanding debt. As at 31 January 2024.
Figure 9. Leverage at pre-pandemic levels
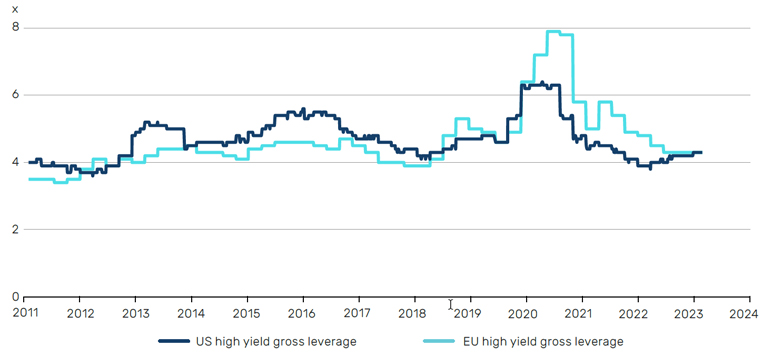
Source: Bank of America HY Credit Chartbook. Gross Leverage (total debt/total EBITDA). As at 31 January 2024.
However, this has not yet translated into a significant rise in default rates, with both US and European high yield ebbing higher to long term average levels, but still well below previous episodes such as the Global Financial Crisis (GFC) or even the commodity related weakness of 2015-2016.
Figure 10. These dynamics have not yet translated into a significant rise in defaults
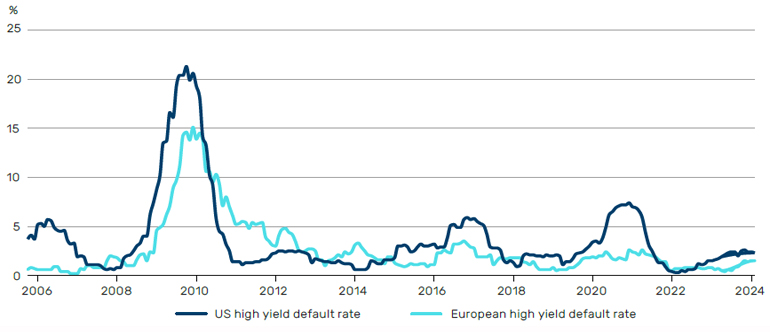
Source: Bank of America HY Credit Chartbook, as at 31 January 2024.
However, on a forward-looking basis, investors may be in for a bumpy ride…
“Maturity walls are commonly presented as a sword of Damocles, but they pose opportunities as well as risks.”
A sword of Damocles?
Maturity walls also indicate that US companies, specifically those with leveraged loans, may struggle to refinance in this environment. While the high yield market in Europe has remained fairly static in size, the leveraged loan market has grown, but has also dramatically deteriorated in quality, with very weak covenant structures and the majority of leveraged loans now unhedged from an interest rate perspective.
In Figure 11, we compare the proportion of high yield bonds and leveraged loans in the US and Europe which are rated B, BB or CCC and lower. It shows that the leveraged loan market in both the US and Europe has a much higher proportion of debt rated CCC and lower which is due to mature in 2024. Given its lower quality level, we believe it could be the first place to suffer.
Figure 11. High proportion of US and Euro CCC rated leveraged loans to mature in 2024.
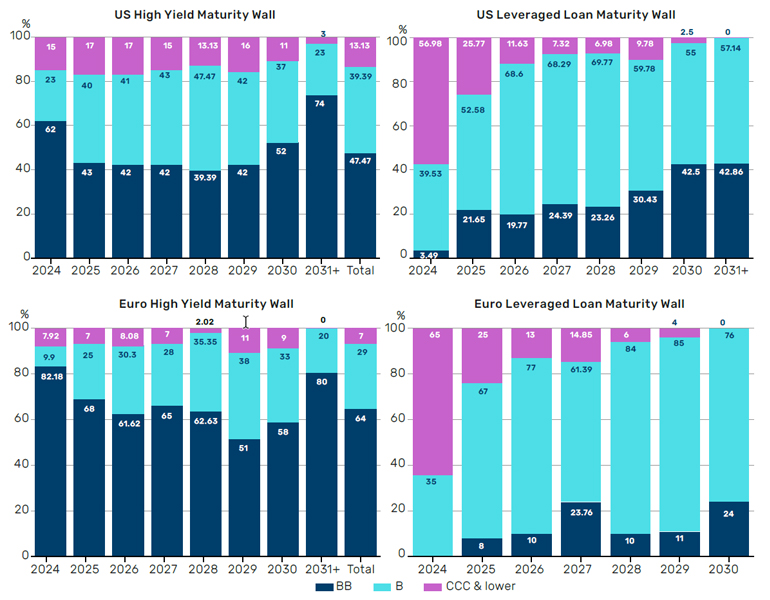
Source: ICE Data Indices, Bloomberg, Morgan Stanley Research. High yield bond maturities, as at January 2024 and leveraged loan maturities, as at October 2023.
With that said, maturity walls are commonly presented as a sword of Damocles, but they pose opportunities as well as risks. In high yield, the market is pricing refinancing risks across the board, some of which are justified, but not all. Businesses with hard assets, such as those in the real estate sector, can typically sell those assets, raise new capital against them or dispose of them to manage their liquidity profile. As ever, it’s a nuanced picture which requires in-depth research to find attractive opportunities.
“Some parts of the market are offering substantial value but in aggregate, there are still large pockets of the market which are expensive.”
As well as differences between sectors, in high yield, we see a disparity in credit quality between the US and Europe, with the former looking especially expensive. Earlier we highlighted that more than 60% of the high yield market trades below 300 basis points and the US market is overrepresented within this category. The US market is considerably more cyclical than in Europe (generally the opposite applies in equities), with the former dominated by oil and gas, chemicals and capital goods companies, which tend to have a high degree of fixed costs and are price takers, meaning they have to accept the prevailing prices in the market rather than having power to influence them.
Further, many European companies are family run organisations and therefore have less aggressive financial policy compared to a private equity owned company in the US which might be very willing to take on high degrees of leverage. In Europe, there is significantly more spread to be had in less cyclically sensitive businesses. As a consequence, some parts of the market are offering substantial value but in aggregate, there are still large pockets of the market which are expensive.
Opportunities for the nimble in financials
In high yield, while pressure is building in the non-financial space, some areas within financials are attractive, in our view. The sector has come under a huge amount of stress given the insolvencies in the US and at Credit Suisse during 2023. This has created mispricing that does not consider the fundamental improvement we have seen from a large number of banks since the GFC. While we expect continued weakness in US banks, particularly given overexposure to commercial real estate, which cannot be fixed by Fed liquidity, we think excess spreads in European financials are broadly unjustified. As a consequence of the more stringent regulatory backdrop in Europe, banks’ capital ratios are higher while they are also benefitting from the higher interest rate environment, particularly in regions such as Iberia where floating rate mortgages are commonplace. While we regard some traditional lenders in Europe as attractively priced, we do not think the risk/return of SME lenders and investment banks is as attractive. This once again underscores the importance of taking a nuanced approach to every asset class and doing a lot of homework and analysis of the documentation.
“While passive investors are essentially cornered into some of the most unattractive parts of the market, active investors have the flexibility to be reactive.”
Selectivity is key
Today’s backdrop of falling inflation and less rosy growth potential will impact earnings and cash flow generation of businesses. We consequently expect the number of dislocations and borrowers getting into trouble to only increase, as well as greater dispersion between sectors, geographies and single names. We believe this will create significant opportunities to uncover value, but having a flexible approach to investing is vital in this environment. While passive investors are essentially cornered into some of the most unattractive parts of the market, active investors have the flexibility to be reactive, to move outside of the aggregate and to select bonds individually by carefully combing through the detail and conducting fundamental analysis.
Conclusion
Although it is taking a little longer to move to the next phase of the cycle, we do believe it is coming. All in all, we expect dispersion to increase as growth slows. While this is likely to bode poorly for high yield returns at an index level, given the current environment is not built for indiscriminate beta players, we believe the backdrop creates an attractive opportunity set for high conviction, bottom-up, active managers able to uncover companies which have very strong solvency, profitability, liquidity and differentiated business models.
This information herein is being provided by GAMA Investimentos (“Distributor”), as the distributor of the website. The content of this document contains proprietary information about Man Investments AG (“Man”) . Neither part of this document nor the proprietary information of Man here may be (i) copied, photocopied or duplicated in any way by any means or (ii) distributed without Man’s prior written consent. Important disclosures are included throughout this documenand should be used for analysis. This document is not intended to be comprehensive or to contain all the information that the recipient may wish when analyzing Man and / or their respective managed or future managed products This material cannot be used as the basis for any investment decision. The recipient must rely exclusively on the constitutive documents of the any product and its own independent analysis. Although Gama and their affiliates believe that all information contained herein is accurate, neither makes any representations or guarantees as to the conclusion or needs of this information.
This information may contain forecasts statements that involve risks and uncertainties; actual results may differ materially from any expectations, projections or forecasts made or inferred in such forecasts statements. Therefore, recipients are cautioned not to place undue reliance on these forecasts statements. Projections and / or future values of unrealized investments will depend, among other factors, on future operating results, the value of assets and market conditions at the time of disposal, legal and contractual restrictions on transfer that may limit liquidity, any transaction costs and timing and form of sale, which may differ from the assumptions and circumstances on which current perspectives are based, and many of which are difficult to predict. Past performance is not indicative of future results. (if not okay to remove, please just remove reference to Man Fund).

